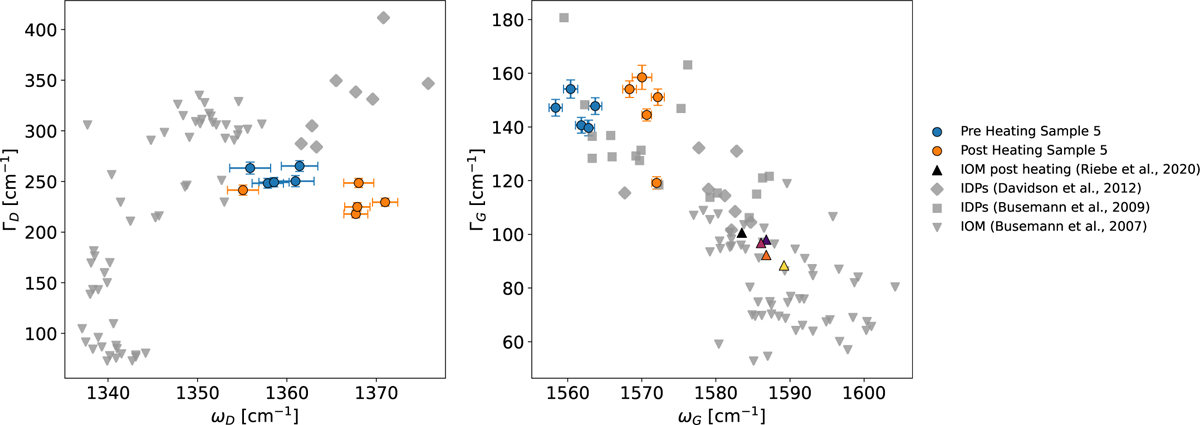
Fig. 9
Download original image
D and G band parameters for a pre- and post-heated residue of an irradiated H2O: CH3OH: N2 ice. The data from Riebe et al. (2020) are plotted as well, where IOM was flash heated using a pyroprobe. A lighter color indicates heating to a higher temperature. The black triangle is unheated, and the other data points correspond to 400°C, 600°C, 800°C, and 1000°C.
Current usage metrics show cumulative count of Article Views (full-text article views including HTML views, PDF and ePub downloads, according to the available data) and Abstracts Views on Vision4Press platform.
Data correspond to usage on the plateform after 2015. The current usage metrics is available 48-96 hours after online publication and is updated daily on week days.
Initial download of the metrics may take a while.