Open Access
Fig. 1
Download original image
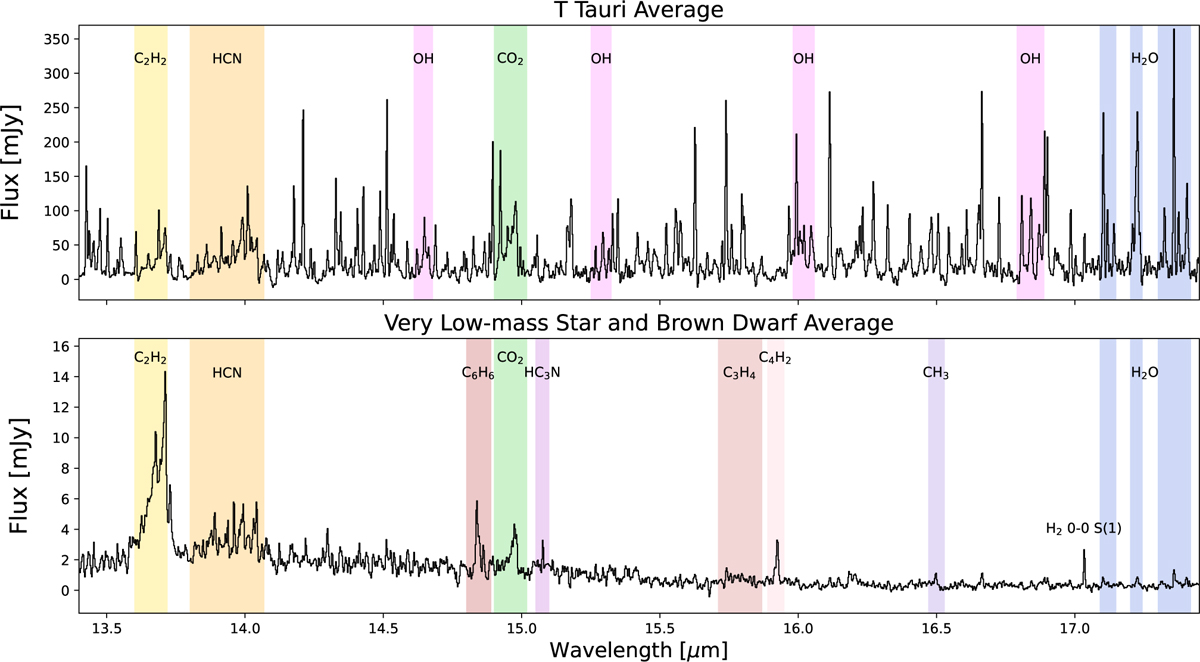
Average T Tauri (top) and VLMS (bottom) sample JWST spectra. The detected molecular species are highlighted. The C2H2 and H2O regions (yellow and blue, respectively) show the regions over which the fluxes were integrated. Most of the unlabeled lines in the T Tauri average are various H2O transitions.
Current usage metrics show cumulative count of Article Views (full-text article views including HTML views, PDF and ePub downloads, according to the available data) and Abstracts Views on Vision4Press platform.
Data correspond to usage on the plateform after 2015. The current usage metrics is available 48-96 hours after online publication and is updated daily on week days.
Initial download of the metrics may take a while.