Fig. 2
Download original image
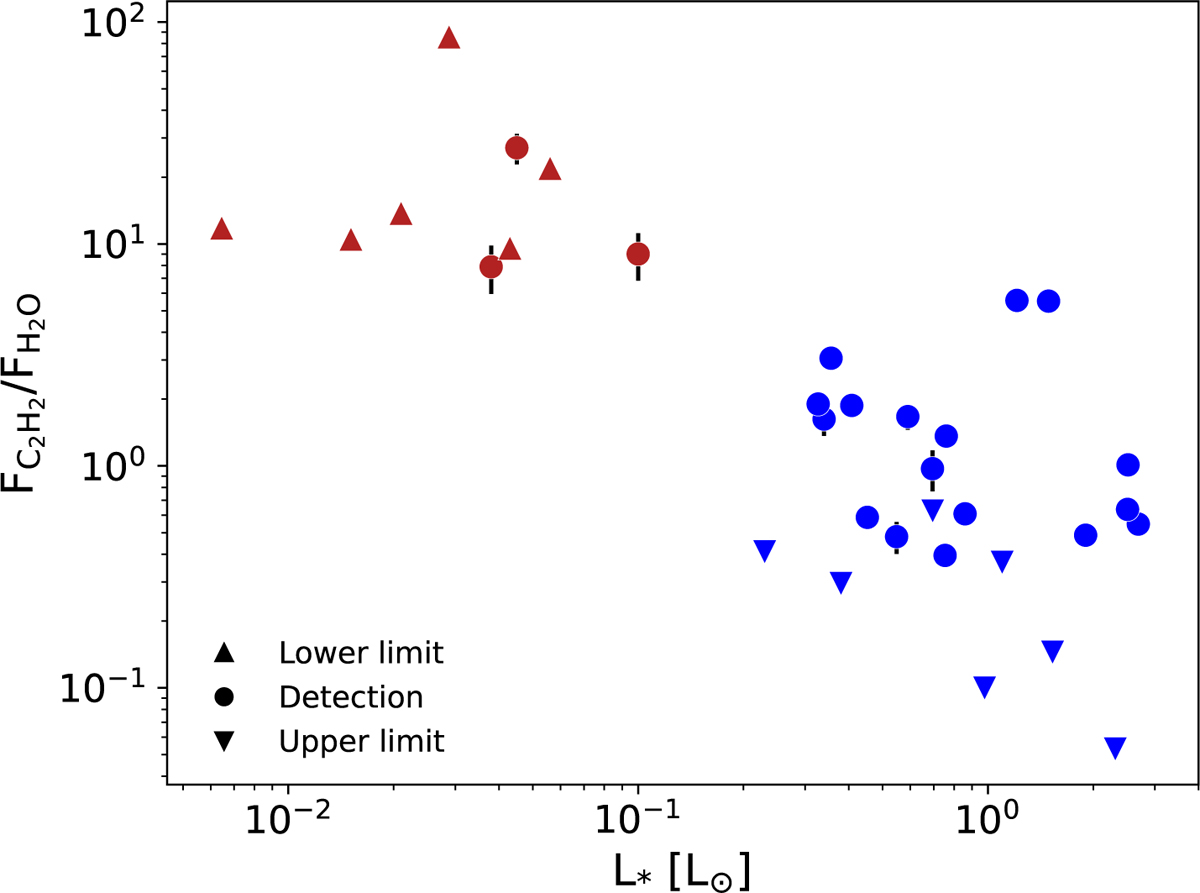
Relation between the flux ratio of C2H2 to H2O as a function of stellar luminosity. Objects with M*>0.2 M⊙ are shown in blue and represent our T Tauri sample, and those with stellar masses below 0.2 M⊙ are our VLMS sample and are shown in red. The two outliers around L* ~ 1 L⊙ are DL Tau and V1094 Sco, which will be analyzed in detail in Tabone et al. (in prep.). This trend is statistically significant with a p-value of 1.3×10⁻⁷ and a correlation coefficient of −0.77. 3σ upper and lower limits are the downward and upward triangles, respectively. The error bars are smaller than the points for most targets.
Current usage metrics show cumulative count of Article Views (full-text article views including HTML views, PDF and ePub downloads, according to the available data) and Abstracts Views on Vision4Press platform.
Data correspond to usage on the plateform after 2015. The current usage metrics is available 48-96 hours after online publication and is updated daily on week days.
Initial download of the metrics may take a while.