Fig. 3
Download original image
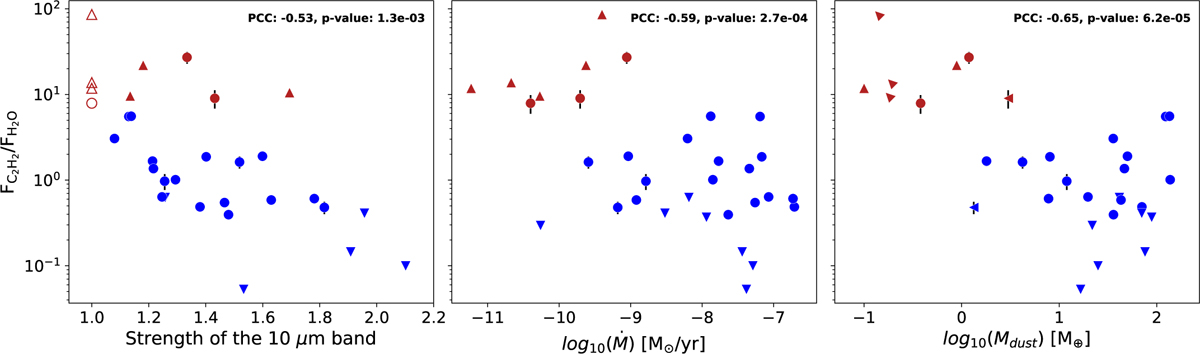
Left: ![]() as a function of the strength of the 10 µm silicate feature (stronger silicate features have higher values). The four VLMSs for which we adopt a feature strength of one are denoted by open points. The two outliers at a 10 µm band strength of 3 and 3.8 are the transitional disks LkCa 15 and PDS 70, which were removed for clarity. Middle: relation between
as a function of the strength of the 10 µm silicate feature (stronger silicate features have higher values). The four VLMSs for which we adopt a feature strength of one are denoted by open points. The two outliers at a 10 µm band strength of 3 and 3.8 are the transitional disks LkCa 15 and PDS 70, which were removed for clarity. Middle: relation between ![]() and Ṁ. Right: relation between
and Ṁ. Right: relation between ![]() and Mdust. The PCCs and p-values can be found for each panel. All of the relations are statistically significant (p-value<0.05); however the correlations are not as strong as the
and Mdust. The PCCs and p-values can be found for each panel. All of the relations are statistically significant (p-value<0.05); however the correlations are not as strong as the ![]() vs. stellar luminosity relation. Rotated triangular markers for the VLMS sample indicate lower limits on
vs. stellar luminosity relation. Rotated triangular markers for the VLMS sample indicate lower limits on ![]() and upper limits on Mdust. The error bars are smaller than the points for most targets.
and upper limits on Mdust. The error bars are smaller than the points for most targets.
Current usage metrics show cumulative count of Article Views (full-text article views including HTML views, PDF and ePub downloads, according to the available data) and Abstracts Views on Vision4Press platform.
Data correspond to usage on the plateform after 2015. The current usage metrics is available 48-96 hours after online publication and is updated daily on week days.
Initial download of the metrics may take a while.