Fig. 5

Download original image
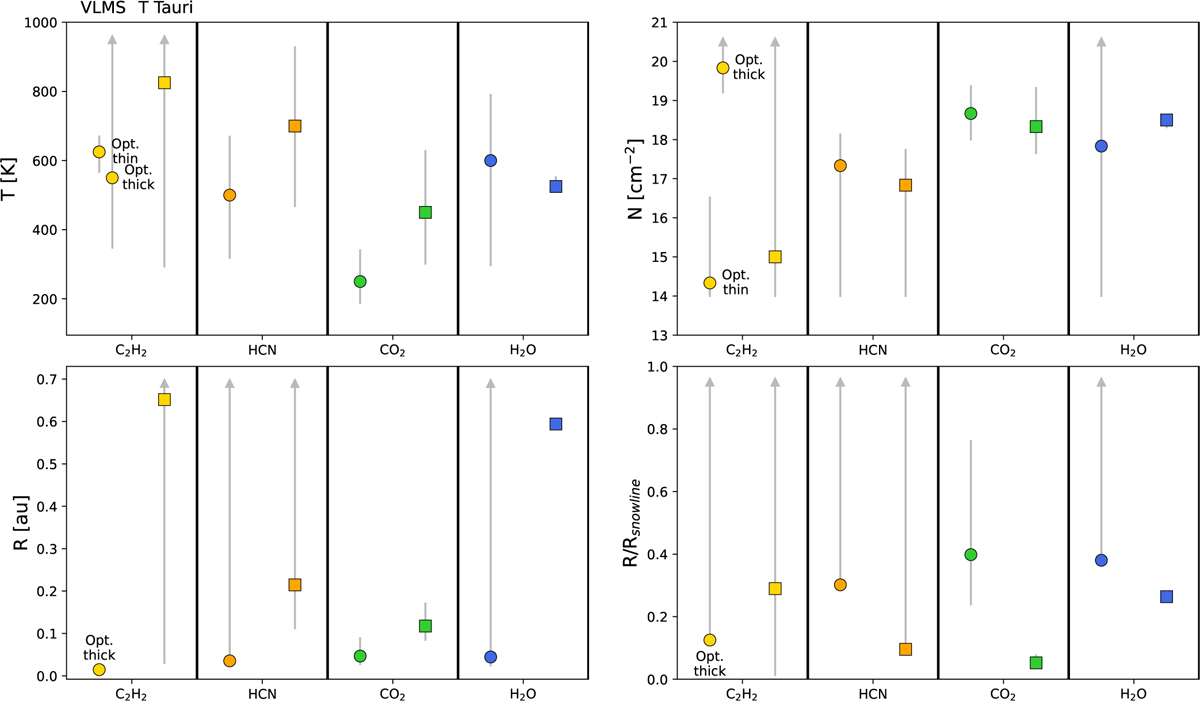
Best-fit slab model parameters for the average VLMS spectrum (left circles) and T Tauri spectrum (right squares) for the different molecules. The H2O component for the T Tauri spectrum is the intermediate (T ~ 600) component. Temperature and column density are shown at the top on the left and right, respectively. The equivalent emitting radius is shown in the bottom left corner, and this radius normalized to the H2O snowline for each subsample is shown in the bottom right corner. Only the optically thick C2H2 component is shown for the VLMS in the radii plots because the radius is unconstrained in the optically thin case. The error bars were determined from the 1σ confidence intervals and in some cases are degenerate between parameters. For example, in the case of optically thin emission, the column density and equivalent emitting radii are degenerate. See Figures B.1 and B.2 for the χ2 maps for the T Tauri and VLMS fits, respectively.
Current usage metrics show cumulative count of Article Views (full-text article views including HTML views, PDF and ePub downloads, according to the available data) and Abstracts Views on Vision4Press platform.
Data correspond to usage on the plateform after 2015. The current usage metrics is available 48-96 hours after online publication and is updated daily on week days.
Initial download of the metrics may take a while.


