Fig. A.1
Download original image
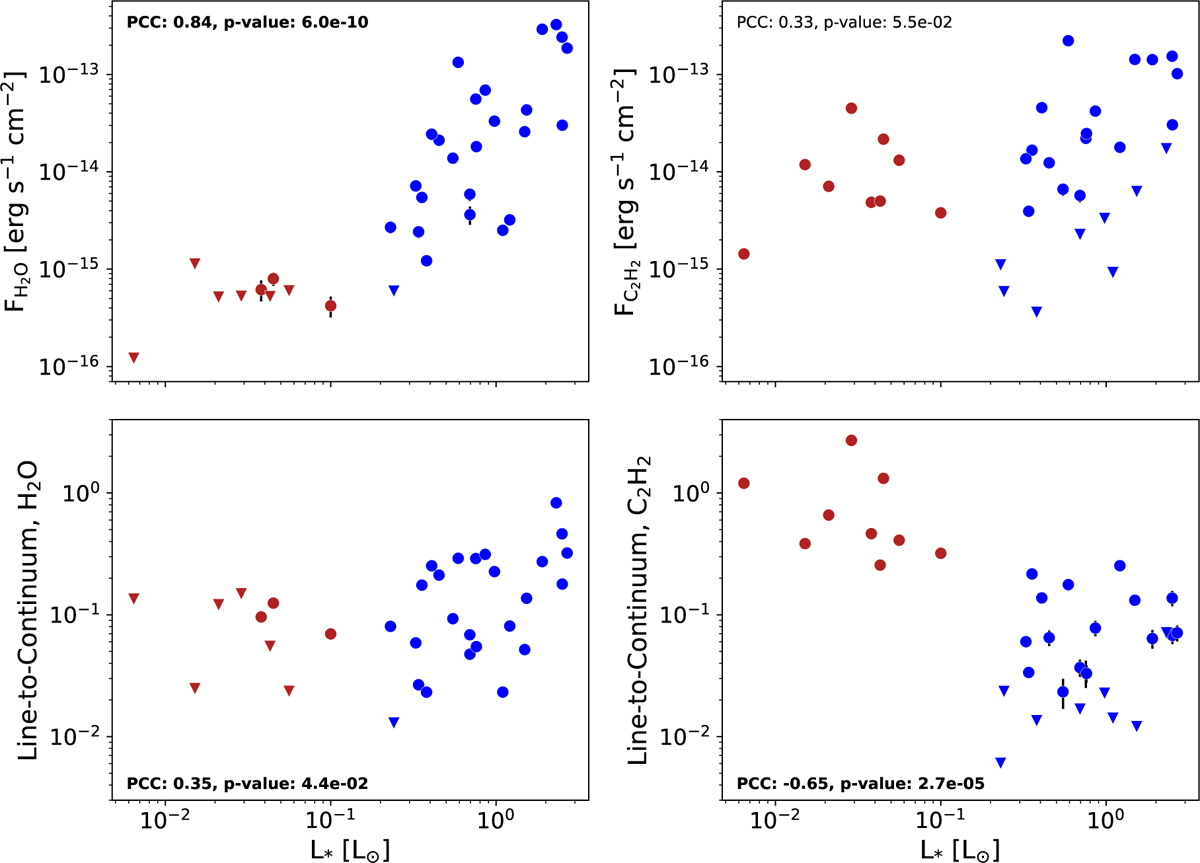
The absolute fluxes of H2O (top left) and C2H2 (top right) as a function of stellar luminosity. The fluxes are determined after normalizing the spectra to a distance of 120 pc. The line-to-continuum ratio for H2O and C2H2 as a function of stellar luminosity are shown in the bottom left and right, respectively. Upper limits (downward triangles) are the 3σ fluxes. Error bars are smaller than the points for most targets. The blue points are the T Tauri sample and the red points are the VLMS targets. The PCCs and p-values can be found for each panel. Significant correlations (p-value<0.05) are provided in bold. ![]() vs. L, (top left) and C2H2 line-to-continuum ratio vs. L, (bottom right) have the strongest correlations.
vs. L, (top left) and C2H2 line-to-continuum ratio vs. L, (bottom right) have the strongest correlations.
Current usage metrics show cumulative count of Article Views (full-text article views including HTML views, PDF and ePub downloads, according to the available data) and Abstracts Views on Vision4Press platform.
Data correspond to usage on the plateform after 2015. The current usage metrics is available 48-96 hours after online publication and is updated daily on week days.
Initial download of the metrics may take a while.