Fig. A.2
Download original image
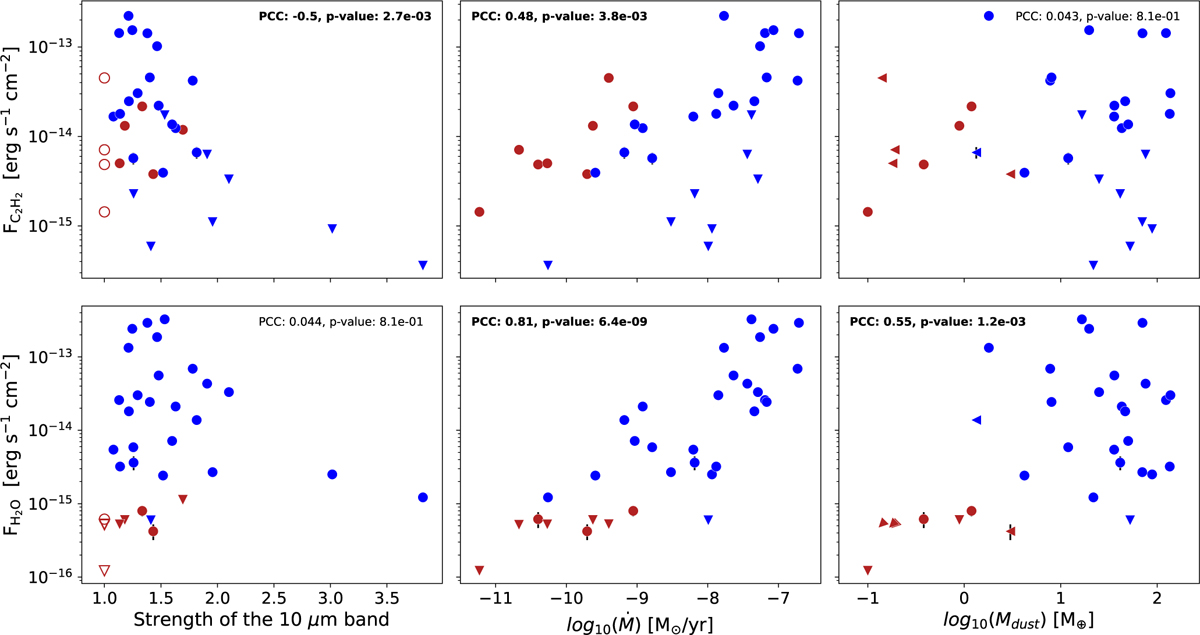
The absolute fluxes of C2H2 (top) and H2O (bottom) as a function of the strength of the 10 µm silicate feature (left), stellar accretion rate (middle), and dust disk mass (right). The fluxes are normalized to a distance of 120 pc. Upper limits (downward triangles) are the 3σ fluxes; objects with Mdust upper limits are either leftward facing triangles if the molecular species is detected, or rotated triangular markers if both the flux and dust mass are upper limits. Error bars are smaller than the points for most targets. The blue points are the T Tauri sample and the red points are the VLMS targets. The PCCs and p-values can be found for each panel. Significant correlations (p-value<0.05) are provided in bold.
Current usage metrics show cumulative count of Article Views (full-text article views including HTML views, PDF and ePub downloads, according to the available data) and Abstracts Views on Vision4Press platform.
Data correspond to usage on the plateform after 2015. The current usage metrics is available 48-96 hours after online publication and is updated daily on week days.
Initial download of the metrics may take a while.