Open Access
Fig. B.1
Download original image
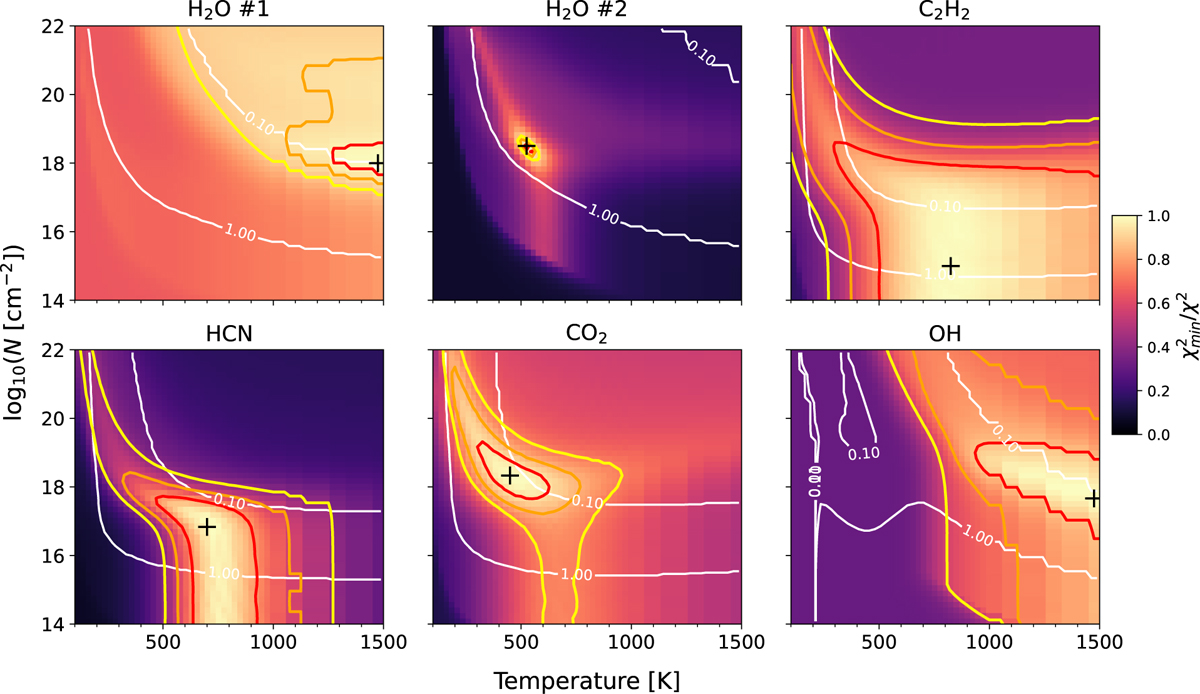
The χ2 maps for the molecules fitted in the average T Tauri spectrum. The color-scale shows ![]() and the red, orange, and yellow contours correspond to the 1σ 2σ and 3σ levels. White contours show the emitting radii in au, as given by the labels. The best-fit model is represented by the black plus.
and the red, orange, and yellow contours correspond to the 1σ 2σ and 3σ levels. White contours show the emitting radii in au, as given by the labels. The best-fit model is represented by the black plus.
Current usage metrics show cumulative count of Article Views (full-text article views including HTML views, PDF and ePub downloads, according to the available data) and Abstracts Views on Vision4Press platform.
Data correspond to usage on the plateform after 2015. The current usage metrics is available 48-96 hours after online publication and is updated daily on week days.
Initial download of the metrics may take a while.