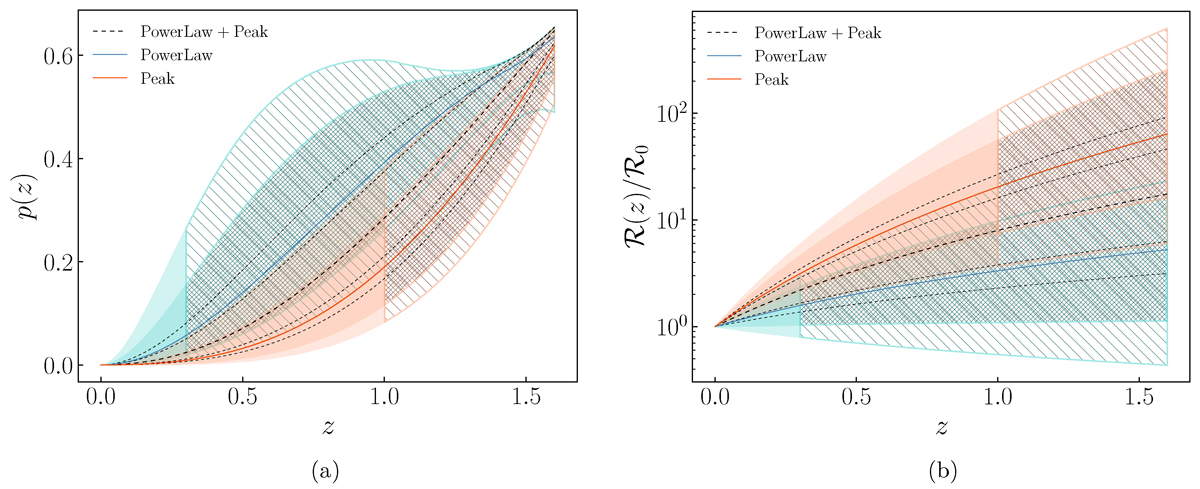
Fig. 5.
Download original image
Left: Probability density for the source redshift. Right: Merger rate density as a function of redshift. In both panels, the coloured regions refer to the two components of the EVOLVING model, whereas the areas delimited by the dashed black line refers to the common evolution of the POWERLAW+PEAK model. The hatched areas mark the extrapolation beyond detector horizon for the corresponding mass range. (a) PDF. (b) Merger rate density.
Current usage metrics show cumulative count of Article Views (full-text article views including HTML views, PDF and ePub downloads, according to the available data) and Abstracts Views on Vision4Press platform.
Data correspond to usage on the plateform after 2015. The current usage metrics is available 48-96 hours after online publication and is updated daily on week days.
Initial download of the metrics may take a while.