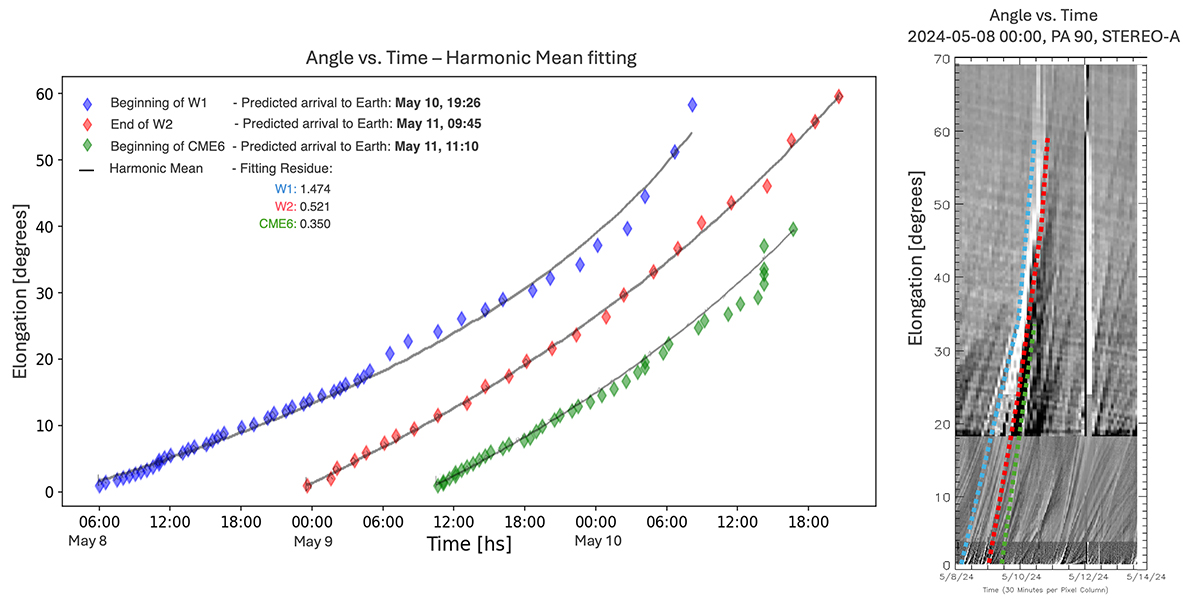
Fig. 4.
Download original image
Left panel: Elongation angle vs. time for the three tracked structures on May 8-10: Beginning of W1 (blue diamonds), end of W2 (red diamonds), and CME6 leading edge (green diamonds). The black continuous line denotes the best HM fit for the three structures. Predicted arrivals to Earth and fitting residues are presented in the figure. Right panel: Jmap at a position angle of 90° for a combination of COR2, HI1, and HI2 on board STEREO-A. Dashed lines represent the mentioned tracked structures: W1, W2, and CME6 respectively in light blue, red, and green.
Current usage metrics show cumulative count of Article Views (full-text article views including HTML views, PDF and ePub downloads, according to the available data) and Abstracts Views on Vision4Press platform.
Data correspond to usage on the plateform after 2015. The current usage metrics is available 48-96 hours after online publication and is updated daily on week days.
Initial download of the metrics may take a while.