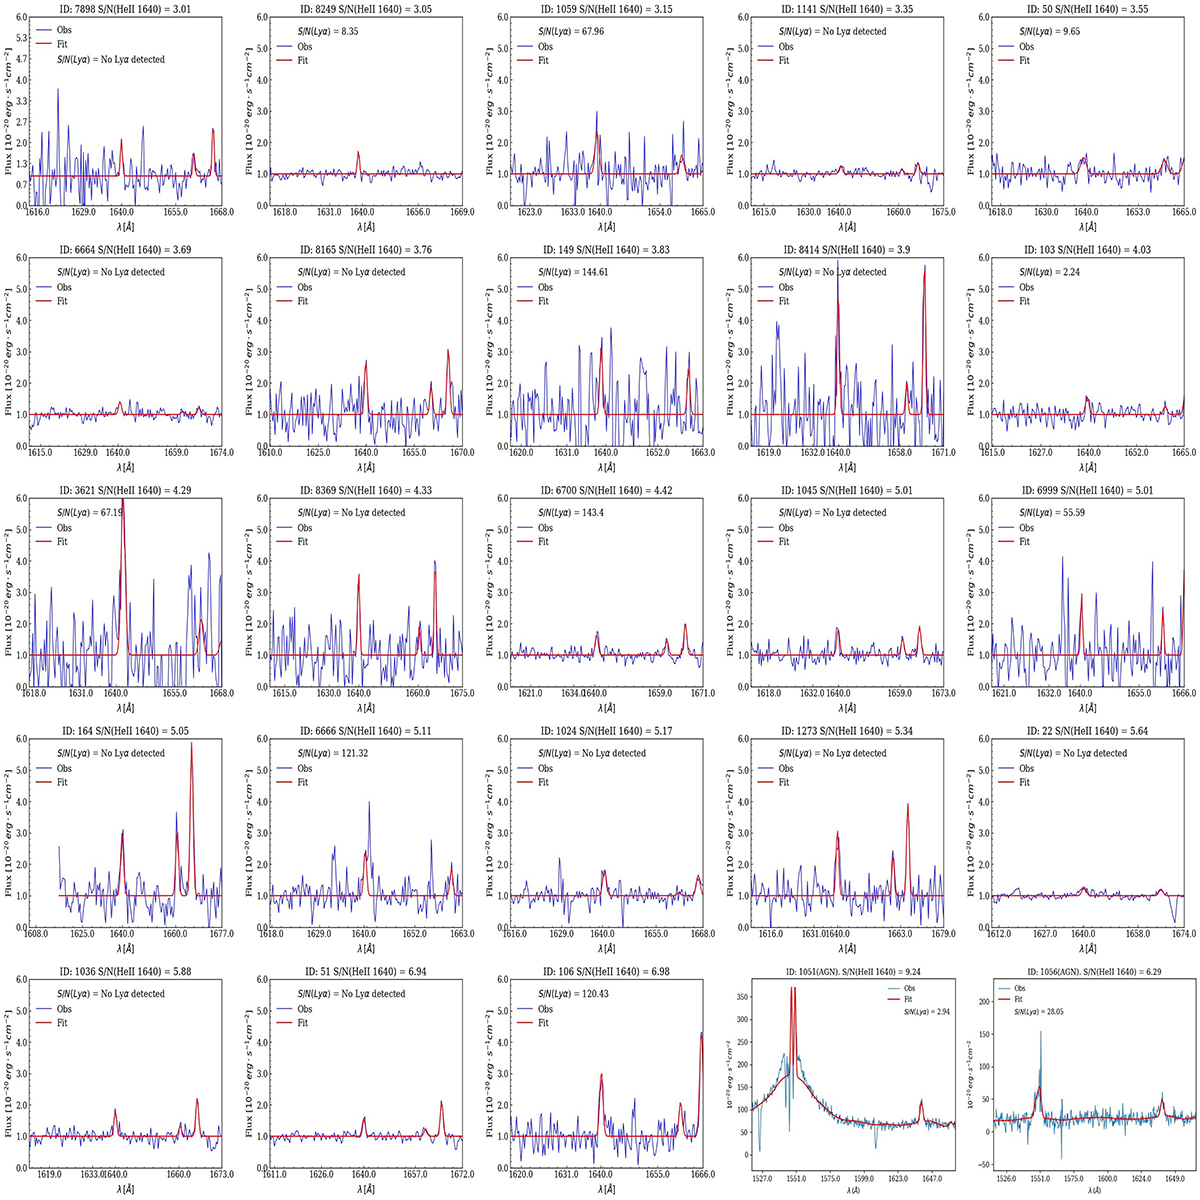
Fig. A.1.
Download original image
He II emitters sample ordered by S/N(He II ). The blue and red spectra represent the reference spectrum and the model continuum + fit, respectively. The S/N of He II and Lyα (when detected) are included in the labels. The last two panels correspond to the two AGNs identified in the sample, exhibiting broad He II and C IV 1548,51 Å lines.
Current usage metrics show cumulative count of Article Views (full-text article views including HTML views, PDF and ePub downloads, according to the available data) and Abstracts Views on Vision4Press platform.
Data correspond to usage on the plateform after 2015. The current usage metrics is available 48-96 hours after online publication and is updated daily on week days.
Initial download of the metrics may take a while.