Fig. 7.
Download original image
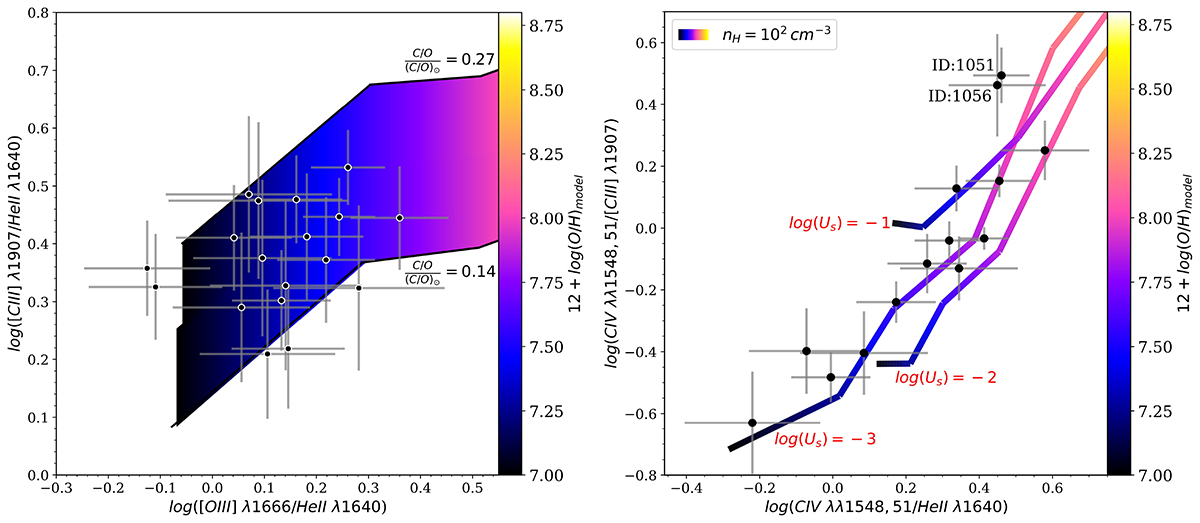
Left: [C III] λ1907/He II – [O III] λ1666/He II diagnosis. The Gutkin et al. (2016) models plotted correspond to a pure photoionisation scenario due to massive stars with log(Us) = − 1, ξd = 0.1, mup = 300 M⊙, and ![]() . The coloured area represents the region where the values of (C/O)/(C/O)⊙ span vertically between 0.14 and 0.27 (both values marked by black lines), while the gas-phase metallicity varies horizontally between 12 + log(O/H) = 7 and 8.75. Right: C IV λλ1548, 51/[C III] λ1907 – C IV λλ1548, 51/He II diagnosis for those galaxies where C IV λλ1548, 51 is detected. The rainbow lines correspond to photoionisation models with gas density nH = 102 cm−3, tracing a metallicity gradient from 12 + log(O/H) = 7 to 8.75. Three different paths are shown, each representing a different ionisation parameter log(Us), ranging from −3 to −1. All models assume a C/O abundance ratio of 0.1(C/O)⊙. The observed scatter reflects a gradient in the ionisation parameter as C IV increases linearly relative to the other lines in a pure photoionisation scenario. In addition, the two AGNs (ID:1051 and ID:1056) present a significantly higher C IV/[C III] ratio, distinguishing them from the rest of the sample. All the points in the two diagnoses lie in the region of very low metallicity (12 + log(O/H) < 7.7), which are similar to the measured values.
. The coloured area represents the region where the values of (C/O)/(C/O)⊙ span vertically between 0.14 and 0.27 (both values marked by black lines), while the gas-phase metallicity varies horizontally between 12 + log(O/H) = 7 and 8.75. Right: C IV λλ1548, 51/[C III] λ1907 – C IV λλ1548, 51/He II diagnosis for those galaxies where C IV λλ1548, 51 is detected. The rainbow lines correspond to photoionisation models with gas density nH = 102 cm−3, tracing a metallicity gradient from 12 + log(O/H) = 7 to 8.75. Three different paths are shown, each representing a different ionisation parameter log(Us), ranging from −3 to −1. All models assume a C/O abundance ratio of 0.1(C/O)⊙. The observed scatter reflects a gradient in the ionisation parameter as C IV increases linearly relative to the other lines in a pure photoionisation scenario. In addition, the two AGNs (ID:1051 and ID:1056) present a significantly higher C IV/[C III] ratio, distinguishing them from the rest of the sample. All the points in the two diagnoses lie in the region of very low metallicity (12 + log(O/H) < 7.7), which are similar to the measured values.
Current usage metrics show cumulative count of Article Views (full-text article views including HTML views, PDF and ePub downloads, according to the available data) and Abstracts Views on Vision4Press platform.
Data correspond to usage on the plateform after 2015. The current usage metrics is available 48-96 hours after online publication and is updated daily on week days.
Initial download of the metrics may take a while.