Open Access
Fig. 8.
Download original image
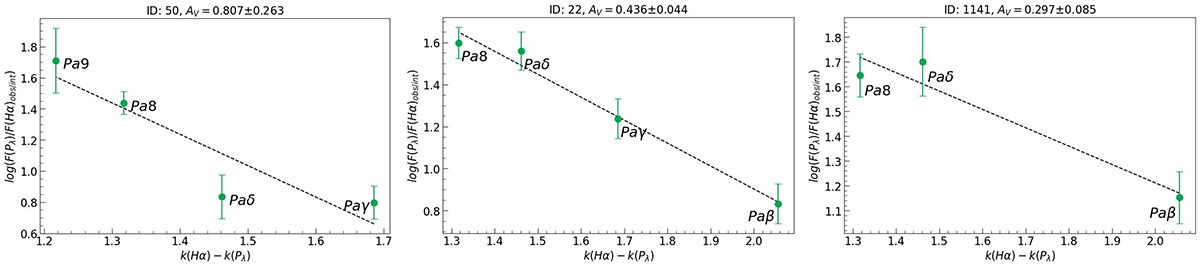
Ratio between observed and theoretical Paschen to Hα flux versus the extinction curve, k(Hα) − k(Pλ), for the three galaxies. The black dashed line represents the linear regression fitting. Every plot is labelled with the AV obtained.
Current usage metrics show cumulative count of Article Views (full-text article views including HTML views, PDF and ePub downloads, according to the available data) and Abstracts Views on Vision4Press platform.
Data correspond to usage on the plateform after 2015. The current usage metrics is available 48-96 hours after online publication and is updated daily on week days.
Initial download of the metrics may take a while.