Fig. 9.
Download original image
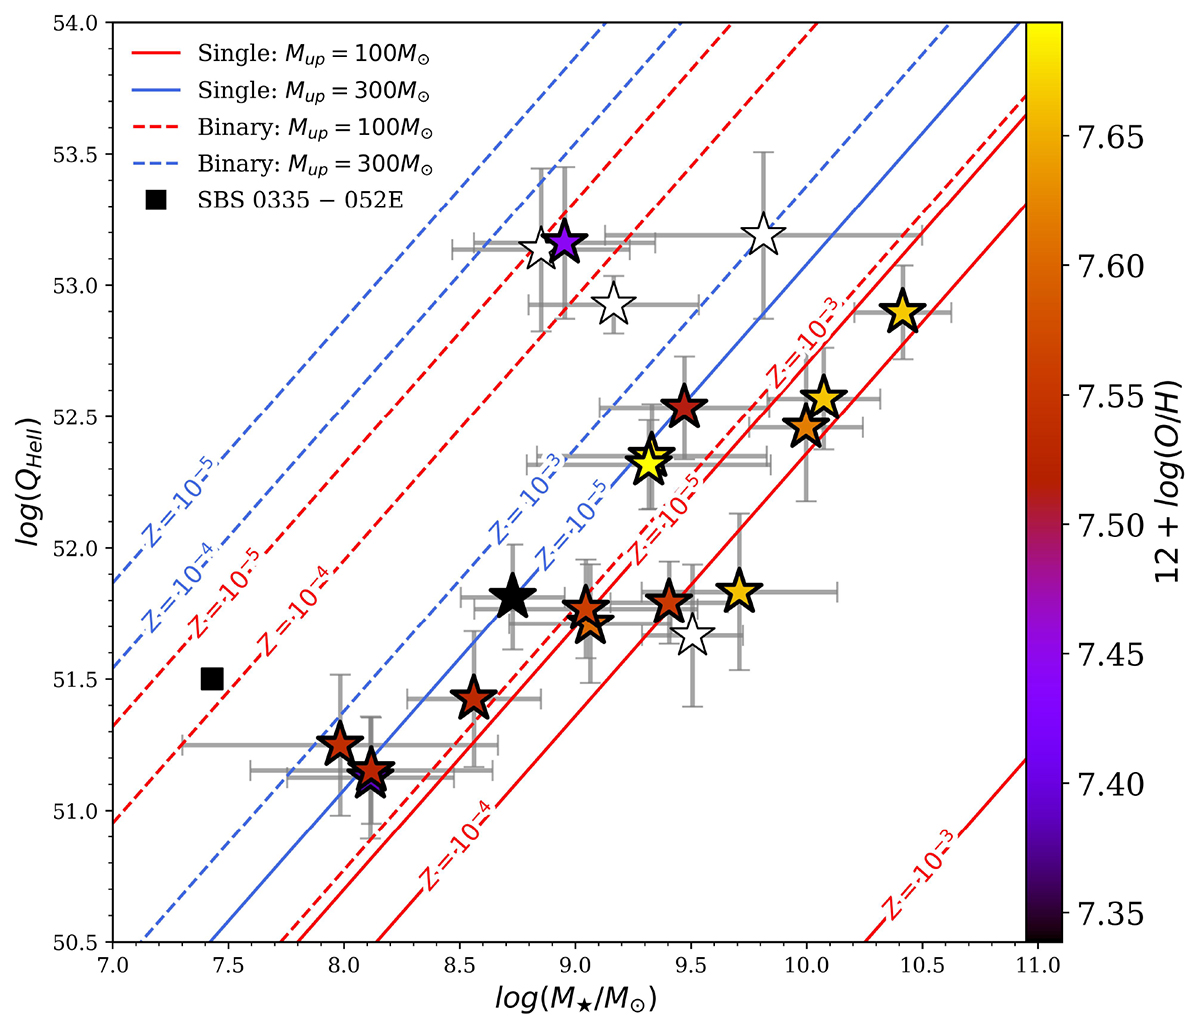
QHeII vs. M⋆ for our sample. The colours correspond to the gas-phase metallicity. The oblique lines represent the QHeII predictions from the BPASS models, scaled linearly with stellar mass. Models with interacting binaries are shown as dashed lines. Those without them are shown as solid lines. In all cases we show the metallicities of Z = 10−3, 10−4, and 10−5. Additionally, we present models adopting a standard Salpeter IMF (Salpeter 1955) with an upper mass limit of ![]() M⊙ (red lines) and models assuming a top-heavy IMF with Mup = 300 M⊙ (blue lines). SBS 0335–052E (Kehrig et al. 2018) is included as a black square, which presents 12 + log(O/H) = 7.3.
M⊙ (red lines) and models assuming a top-heavy IMF with Mup = 300 M⊙ (blue lines). SBS 0335–052E (Kehrig et al. 2018) is included as a black square, which presents 12 + log(O/H) = 7.3.
Current usage metrics show cumulative count of Article Views (full-text article views including HTML views, PDF and ePub downloads, according to the available data) and Abstracts Views on Vision4Press platform.
Data correspond to usage on the plateform after 2015. The current usage metrics is available 48-96 hours after online publication and is updated daily on week days.
Initial download of the metrics may take a while.