Fig. 1.
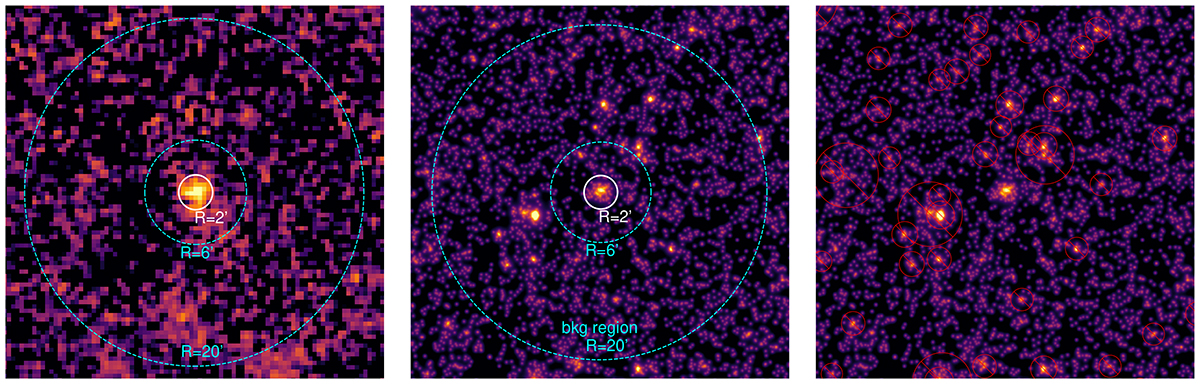
Download original image
Sunyaev-Zel’dovich and X-ray views on the galaxy cluster ACT-CL J0105.8−1839. Left panel: Planck + ACT Compton-y map (Coulton et al. 2024). Middle panel: eROSITA 0.4−2.3 keV image. We used a ring with 6′< R < 20′ to estimate the background, and it was then subtracted from the source region (marked as a white circle). The right panel illustrates the source removal procedure.
Current usage metrics show cumulative count of Article Views (full-text article views including HTML views, PDF and ePub downloads, according to the available data) and Abstracts Views on Vision4Press platform.
Data correspond to usage on the plateform after 2015. The current usage metrics is available 48-96 hours after online publication and is updated daily on week days.
Initial download of the metrics may take a while.