Fig. 2.
Download original image
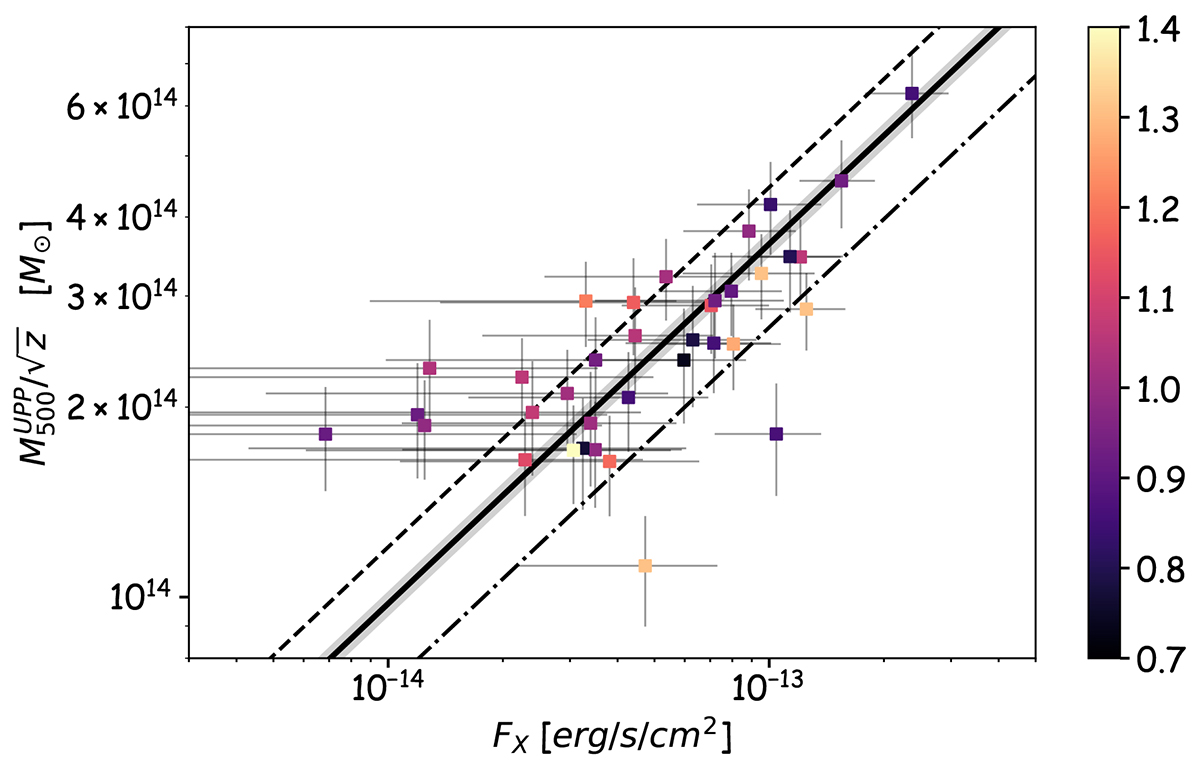
ACT cluster masses ![]() vs. the eROSITA fluxes in the 0.5−2.0 keV energy band for the subsample of ACT/MaDCoWS co-detections from Orlowski-Scherer et al. (2021). X-ray fluxes have been corrected for the expected bias arising from the different resolved fractions of compact sources in the cluster and background regions (see Appendix B). The best-fit relation (2) with η = 0.8 ± 0.03 is shown with a black line and gray shaded area. The dashed and dash-dotted lines illustrate η = 1 and 0.6, respectively. Cluster redshifts are shown with colors.
vs. the eROSITA fluxes in the 0.5−2.0 keV energy band for the subsample of ACT/MaDCoWS co-detections from Orlowski-Scherer et al. (2021). X-ray fluxes have been corrected for the expected bias arising from the different resolved fractions of compact sources in the cluster and background regions (see Appendix B). The best-fit relation (2) with η = 0.8 ± 0.03 is shown with a black line and gray shaded area. The dashed and dash-dotted lines illustrate η = 1 and 0.6, respectively. Cluster redshifts are shown with colors.
Current usage metrics show cumulative count of Article Views (full-text article views including HTML views, PDF and ePub downloads, according to the available data) and Abstracts Views on Vision4Press platform.
Data correspond to usage on the plateform after 2015. The current usage metrics is available 48-96 hours after online publication and is updated daily on week days.
Initial download of the metrics may take a while.