Open Access
Fig. 4.
Download original image
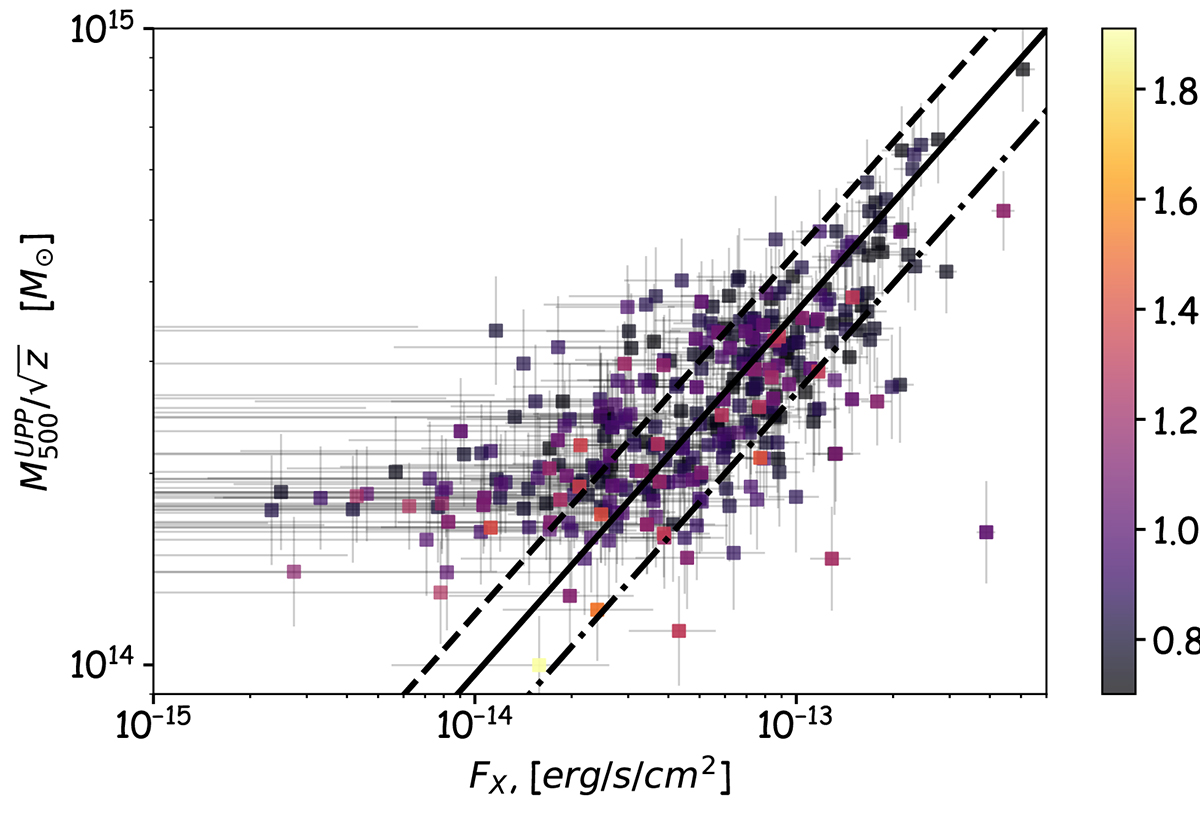
ACT masses ![]() for the subsample of the ACT DR5 clusters with 0° < l < 180° vs. eROSITA 0.5−2.0 keV fluxes extracted from a circle of R = 2′ arcmin centered at a cluster. The dashed, solid, and dotted lines show the FX − M500c relation (Eq. 3) with η = 1.0, 0.8 and 0.6, correspondingly. Cluster redshifts are shown with colors.
for the subsample of the ACT DR5 clusters with 0° < l < 180° vs. eROSITA 0.5−2.0 keV fluxes extracted from a circle of R = 2′ arcmin centered at a cluster. The dashed, solid, and dotted lines show the FX − M500c relation (Eq. 3) with η = 1.0, 0.8 and 0.6, correspondingly. Cluster redshifts are shown with colors.
Current usage metrics show cumulative count of Article Views (full-text article views including HTML views, PDF and ePub downloads, according to the available data) and Abstracts Views on Vision4Press platform.
Data correspond to usage on the plateform after 2015. The current usage metrics is available 48-96 hours after online publication and is updated daily on week days.
Initial download of the metrics may take a while.