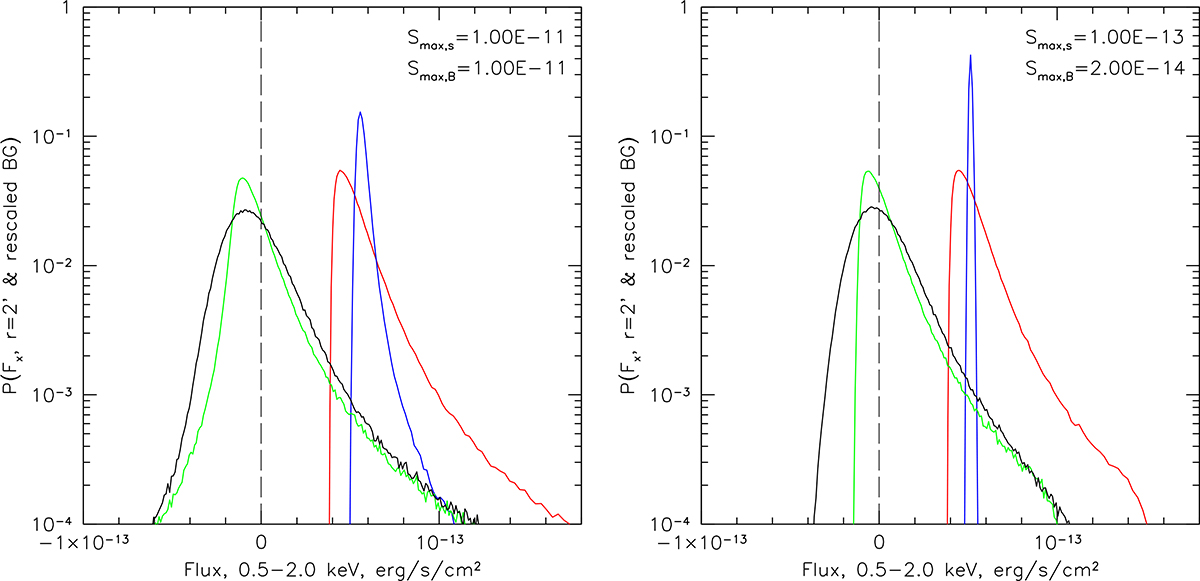
Fig. B.1.
Download original image
Expected distribution of the 0.5-2.0 keV flux in a single circular ‘source’ region (2′ radius) in the eROSITA all-sky survey (red curve) for different levels of the resolved sources in the source and background regions. The red curve corresponds to the distribution of fluxes (including diffuse and particle backgrounds) in the source region, while the blue curve shows the flux distribution in the background region (∼100 times larger solid angle) after rescaling to the area of the source region. These distributions are driven by fluctuations of CXB sources in these regions. The green curve shows the distribution of fluxes in the source region once the contribution of the background was subtracted. Finally, the black curve shows the same distribution to which photon counting noise has been added. In the left panel, only extremely bright sources are excluded with FX > 10−11 erg s−1 in the 0.5 − 2 keV band. Such sources are very rare and do not contribute much to the mean CXB background. In practice, this flux cut effectively corresponds to the case when no CXB sources are resolved. In the right panel, fainter sources (FX > 2 × 10⁻¹⁴ erg s−1) have been removed from the background region, while in the source region, only sources brighter than FX > 1 × 10⁻¹³ erg s−1 have been removed. This reduces the scatter in the estimated flux in the background region but introduces a small bias in the mean flux since a larger fraction of the mean CXB flux is resolved in the background region.
Current usage metrics show cumulative count of Article Views (full-text article views including HTML views, PDF and ePub downloads, according to the available data) and Abstracts Views on Vision4Press platform.
Data correspond to usage on the plateform after 2015. The current usage metrics is available 48-96 hours after online publication and is updated daily on week days.
Initial download of the metrics may take a while.