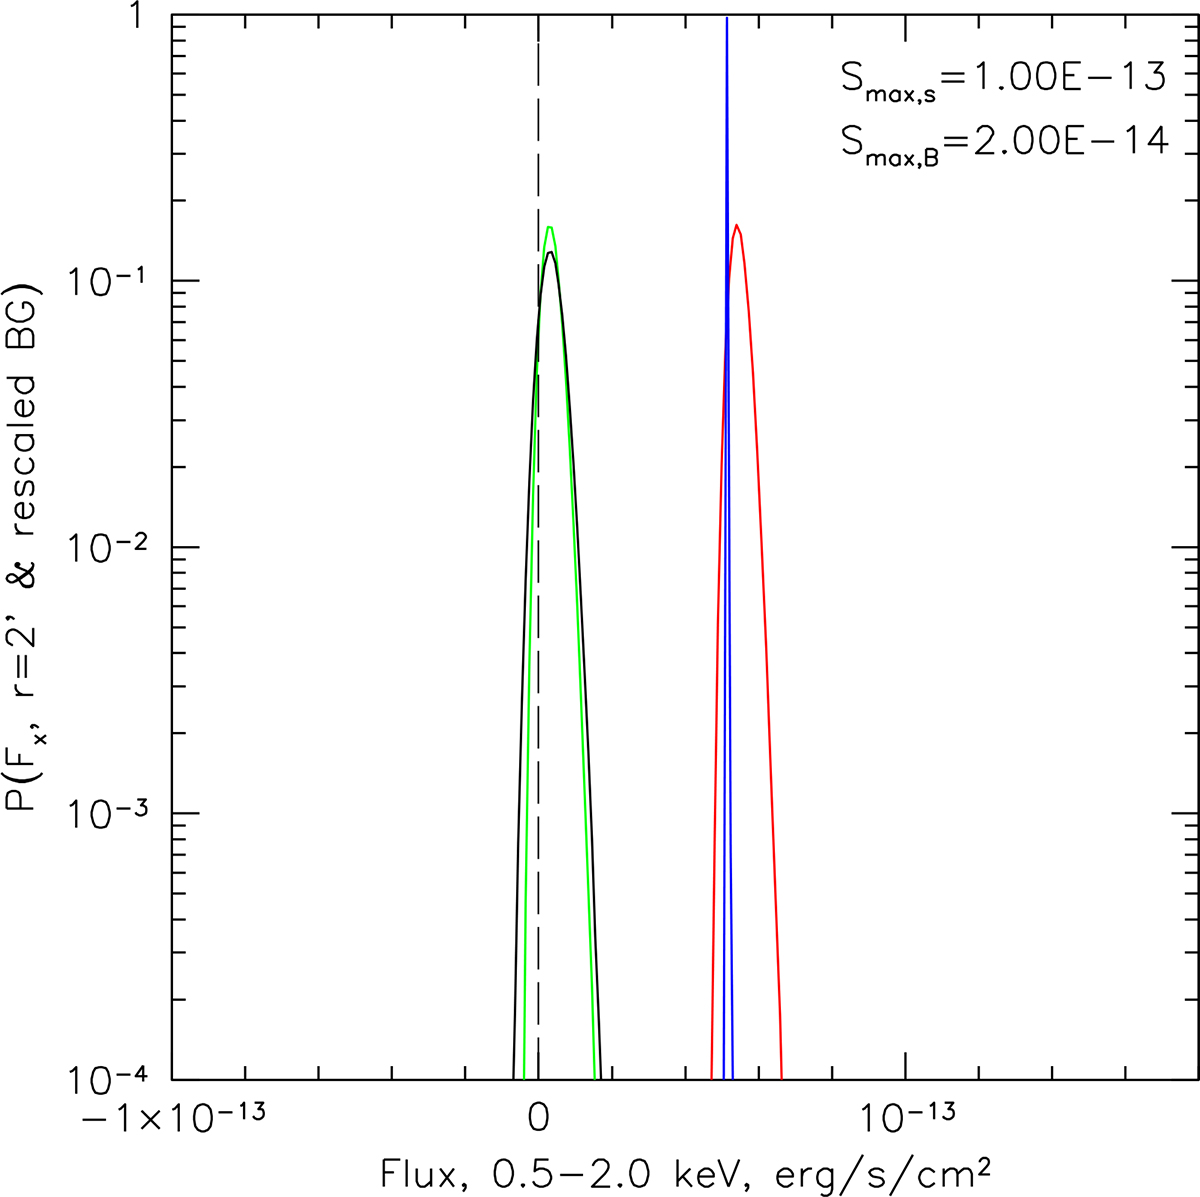
Fig. B.2.
Download original image
Same as Fig. B.1 (right panel) after averaging over a sample of Nobj = 36 objects. Now, the distributions are much narrower, and the mode and mean of the distributions agree well and feature only a small deviation from zero. This means that while individual flux measurements have a broad and biased distribution, the mean flux of the sample has a significantly smaller bias that is largely driven by the different resolved fractions of the CXB.
Current usage metrics show cumulative count of Article Views (full-text article views including HTML views, PDF and ePub downloads, according to the available data) and Abstracts Views on Vision4Press platform.
Data correspond to usage on the plateform after 2015. The current usage metrics is available 48-96 hours after online publication and is updated daily on week days.
Initial download of the metrics may take a while.