Open Access
Fig. B.3.
Download original image
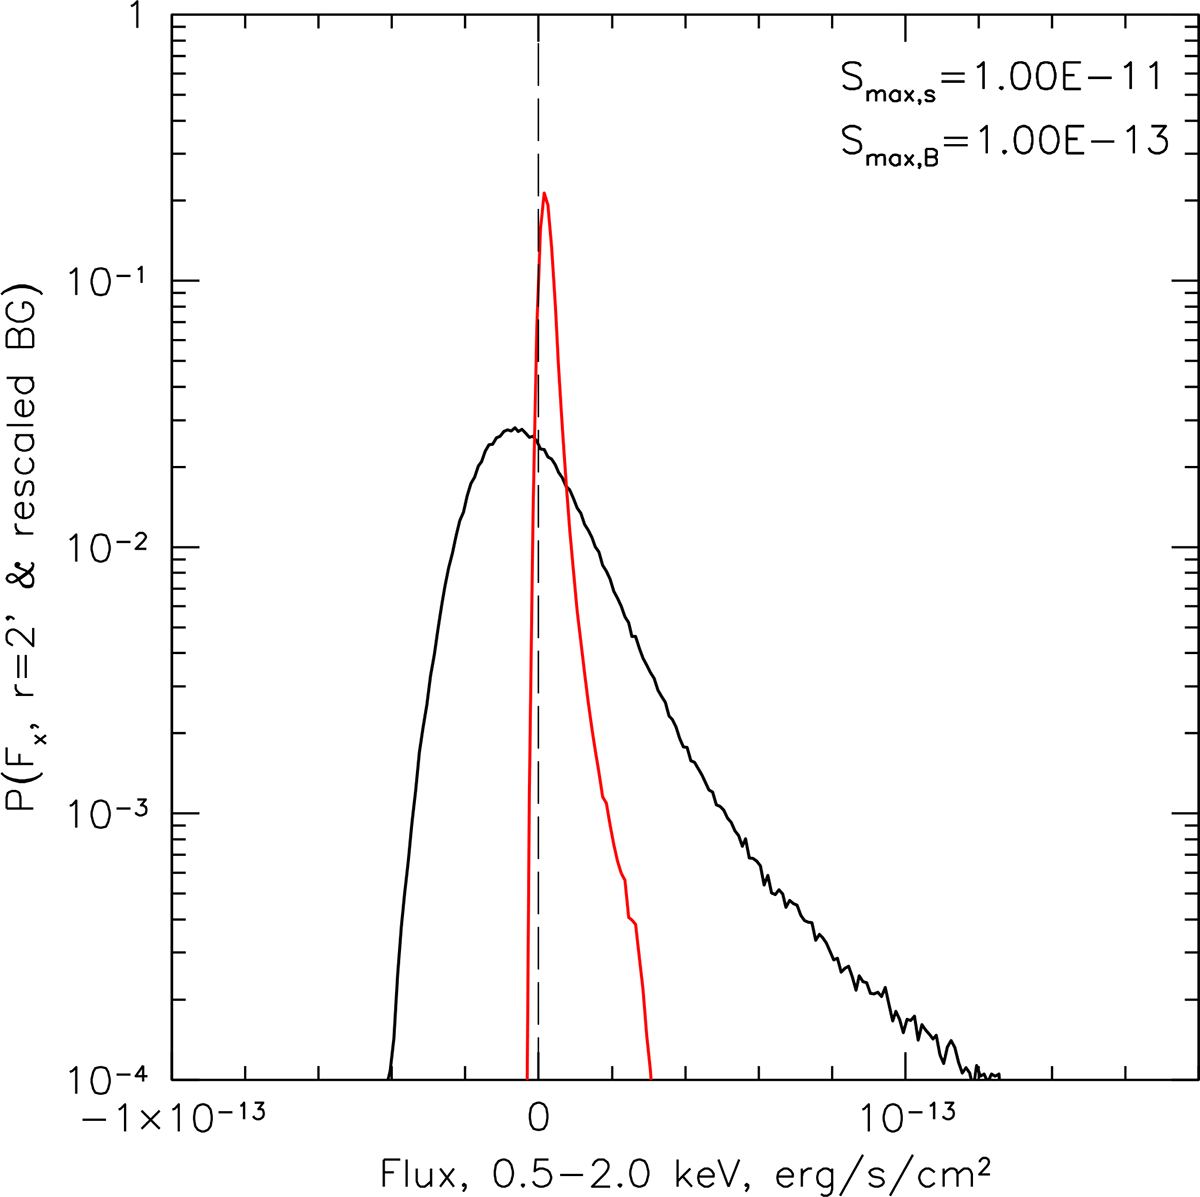
Simulated distribution of the background-subtracted fluxes in the 2′ circle apertures for a sample of 364 objects when CXB sources with fluxes above 10−13 erg s−1 cm−2 are resolved in the background region. The black line corresponds to a single realization, while the red line applies to the sample-averaged flux.
Current usage metrics show cumulative count of Article Views (full-text article views including HTML views, PDF and ePub downloads, according to the available data) and Abstracts Views on Vision4Press platform.
Data correspond to usage on the plateform after 2015. The current usage metrics is available 48-96 hours after online publication and is updated daily on week days.
Initial download of the metrics may take a while.