Fig. 1
Download original image
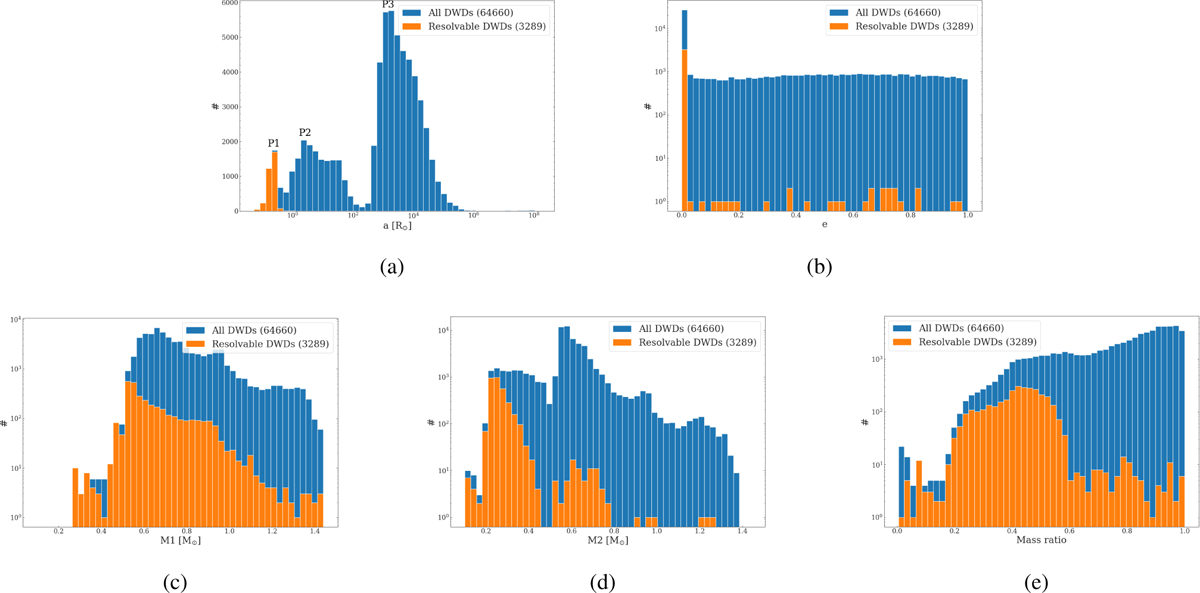
Histograms of the binary property distributions. The blue bars represent the whole dataset (64 660 binaries), while the orange bars represent the resolvable binaries (3289 binaries). Panel a shows the semimajor axis, panel b shows the eccentricity, panels c and d show the primary and secondary mass, respectively, and panel e shows the mass ratio ![]() .
.
Current usage metrics show cumulative count of Article Views (full-text article views including HTML views, PDF and ePub downloads, according to the available data) and Abstracts Views on Vision4Press platform.
Data correspond to usage on the plateform after 2015. The current usage metrics is available 48-96 hours after online publication and is updated daily on week days.
Initial download of the metrics may take a while.