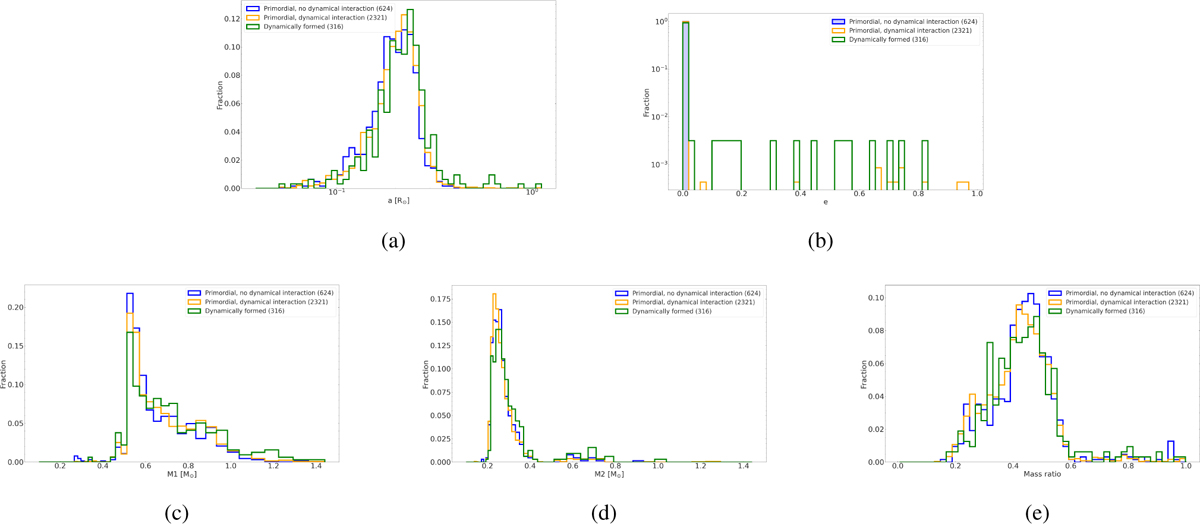
Fig. 2
Download original image
Histograms of the resolvable binary property distributions of the three formation channels: primordial binaries that were not involved in any dynamical interaction (blue), primordial binaries that were involved in dynamical interactions (orange), and dynamically formed binaries (green). Panel a shows the semimajor axis, panel b shows the eccentricity in log scale to highlight outliers, panels c and d show the primary and secondary mass, respectively, and panel e shows the mass ratio ![]() .
.
Current usage metrics show cumulative count of Article Views (full-text article views including HTML views, PDF and ePub downloads, according to the available data) and Abstracts Views on Vision4Press platform.
Data correspond to usage on the plateform after 2015. The current usage metrics is available 48-96 hours after online publication and is updated daily on week days.
Initial download of the metrics may take a while.