Fig. 2
Download original image
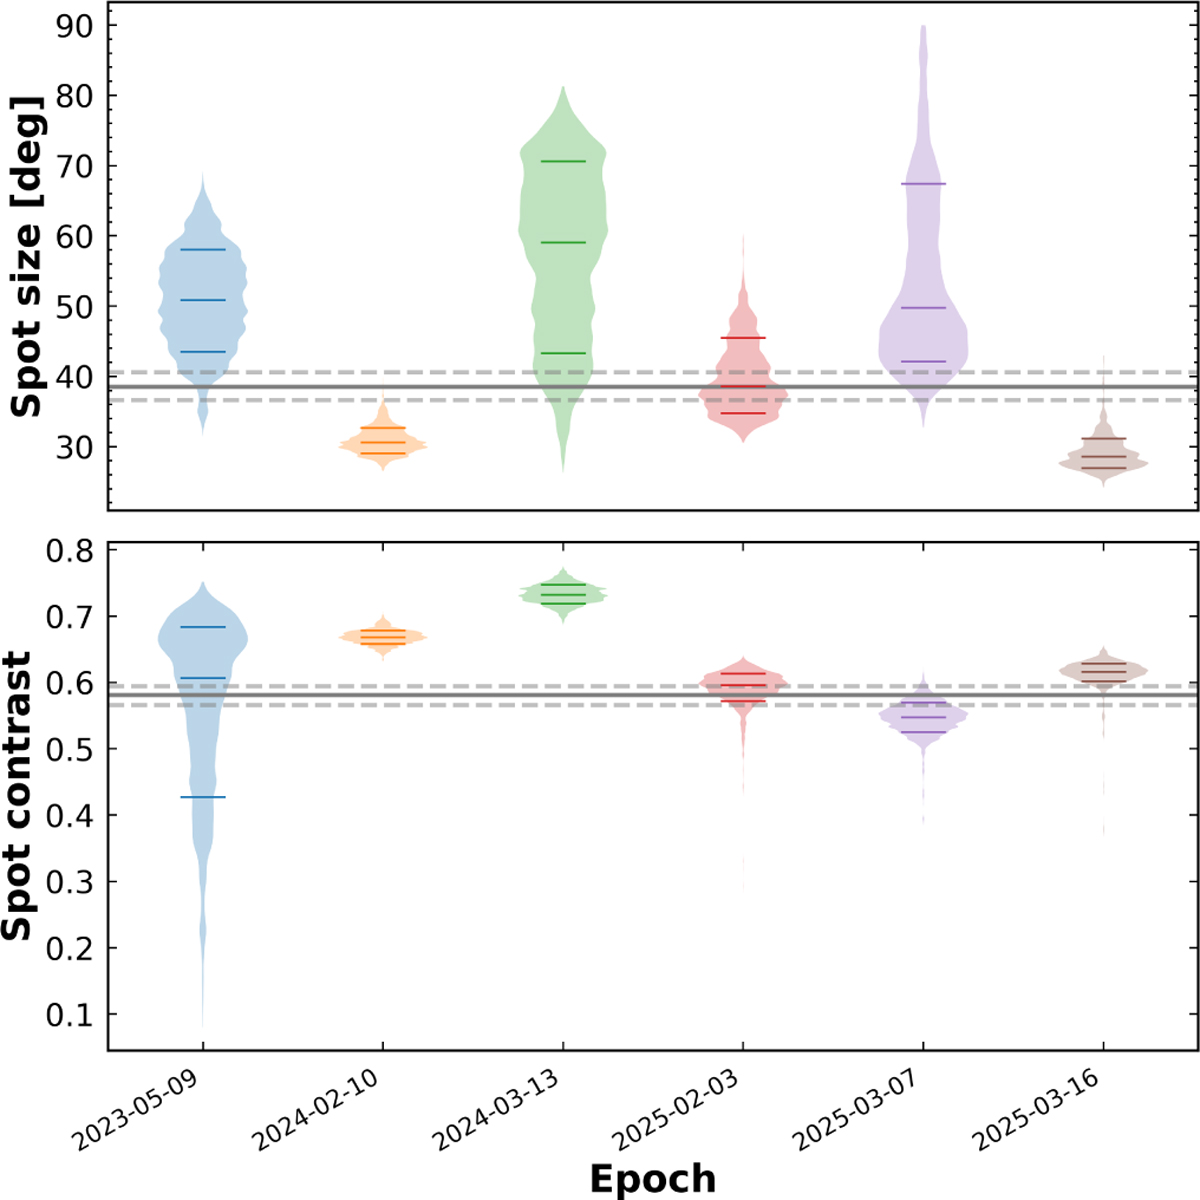
Posteriors for spot size and contrast for TOI-3884. Top panel: Violin plot with spot sizes and posterior distributions for each observation obtained using the first approach (i.e. spot evolution). Lower panel: spot contrast. The horizontal lines show the median spot size and contrast obtained using the second approach (i.e. spin-spot misalignment), with dashed lines showing the 1σ limits.
Current usage metrics show cumulative count of Article Views (full-text article views including HTML views, PDF and ePub downloads, according to the available data) and Abstracts Views on Vision4Press platform.
Data correspond to usage on the plateform after 2015. The current usage metrics is available 48-96 hours after online publication and is updated daily on week days.
Initial download of the metrics may take a while.