Fig. 3
Download original image
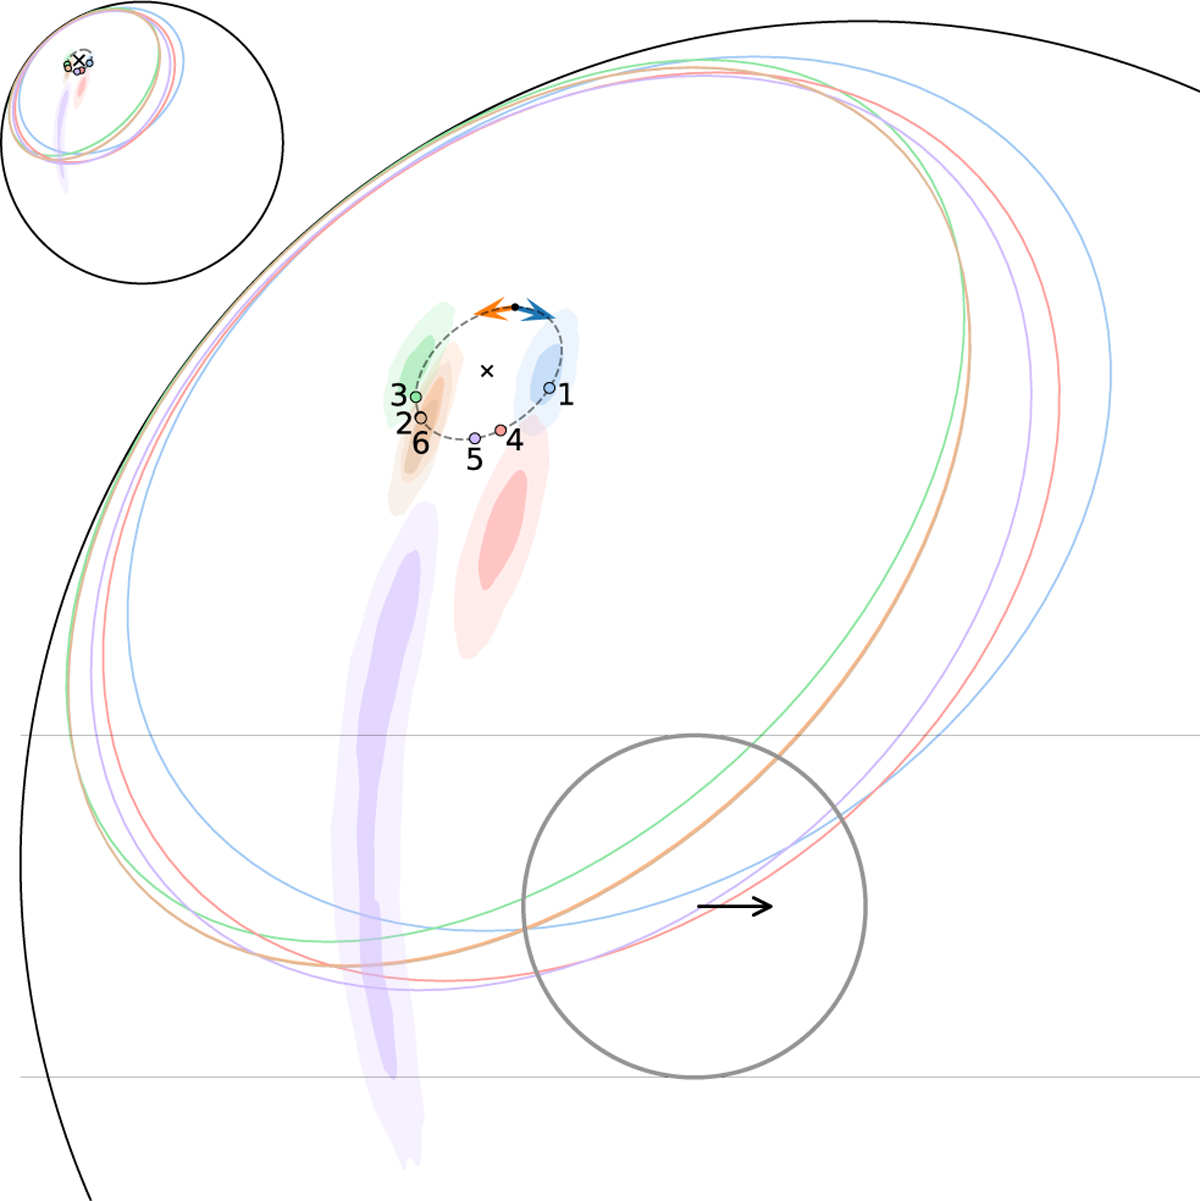
Posterior position of the spot centre on the stellar surface, as inferred from the second (i.e. spin-spot misalignment) approach for each transit observation, shown with shaded regions indicating the 1σ and 2σ credible intervals, using the same colour coding as in Figs. 1 and 2. The transit path for the best-fit model is represented by horizontal lines, while the planet, depicted as a circle, contains an arrow indicating its direction of movement. The best-fit spherical circle for the spin-spot misalignment model is shown with a dashed grey line, with coloured dots representing the positions of the transit observations. The coloured circles centred on these points represent the spot. The black dot in the spherical circle indicates the position at the reference time, while the black diagonal cross marks the position of the spin axis. An orange arrow represents CCW movement, while a blue arrow represents CW movement.
Current usage metrics show cumulative count of Article Views (full-text article views including HTML views, PDF and ePub downloads, according to the available data) and Abstracts Views on Vision4Press platform.
Data correspond to usage on the plateform after 2015. The current usage metrics is available 48-96 hours after online publication and is updated daily on week days.
Initial download of the metrics may take a while.