Fig. 2
Download original image
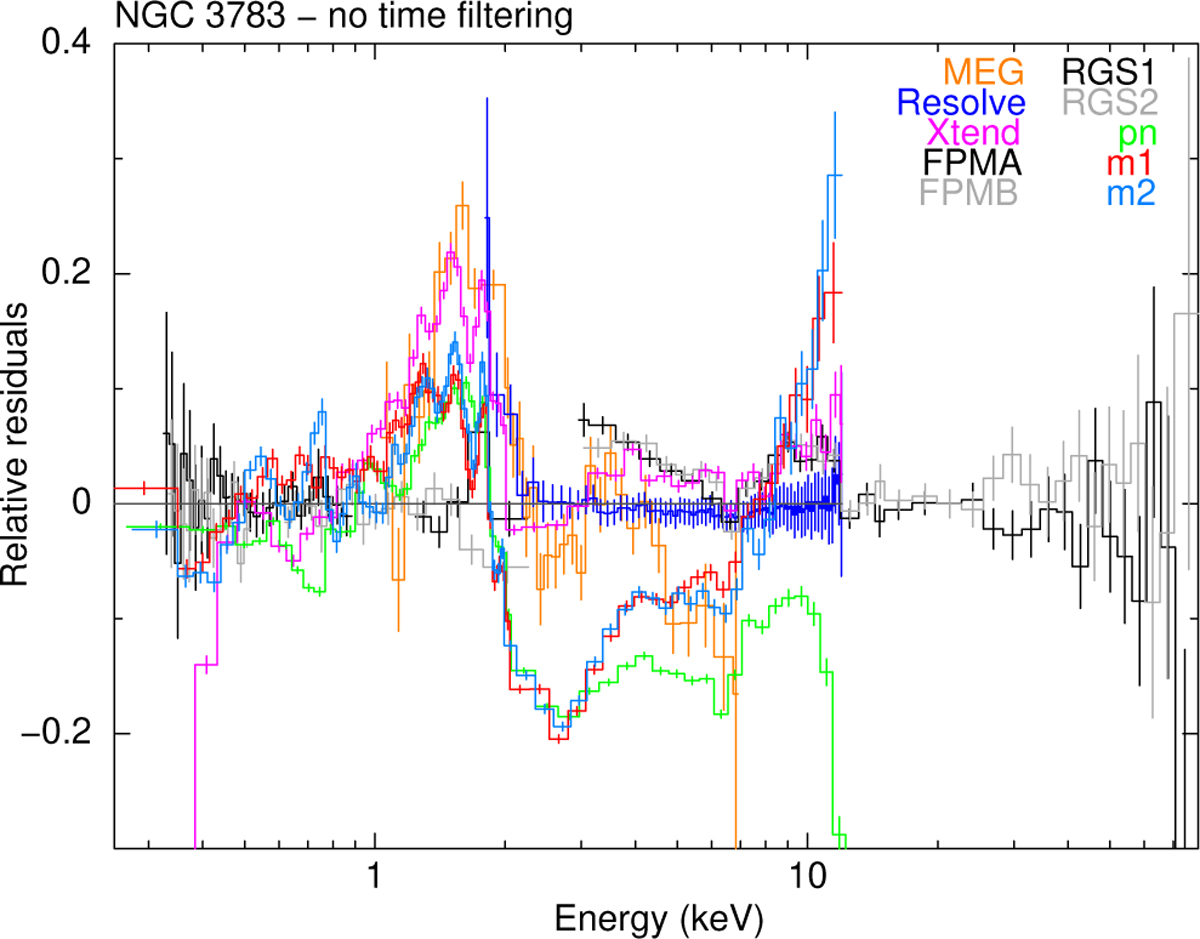
Relative residuals (data/model-1) against a common spline model applied to RGS, Resolve, and NuSTAR data (details in the text). Differences between residuals mainly indicate differences of the effective area with respect to the effective area calibrations. The residuals have been binned for clarity. The black and grey residuals refer to RGS1/2 below 3 keV and to FPMA/B above 3 keV.
Current usage metrics show cumulative count of Article Views (full-text article views including HTML views, PDF and ePub downloads, according to the available data) and Abstracts Views on Vision4Press platform.
Data correspond to usage on the plateform after 2015. The current usage metrics is available 48-96 hours after online publication and is updated daily on week days.
Initial download of the metrics may take a while.