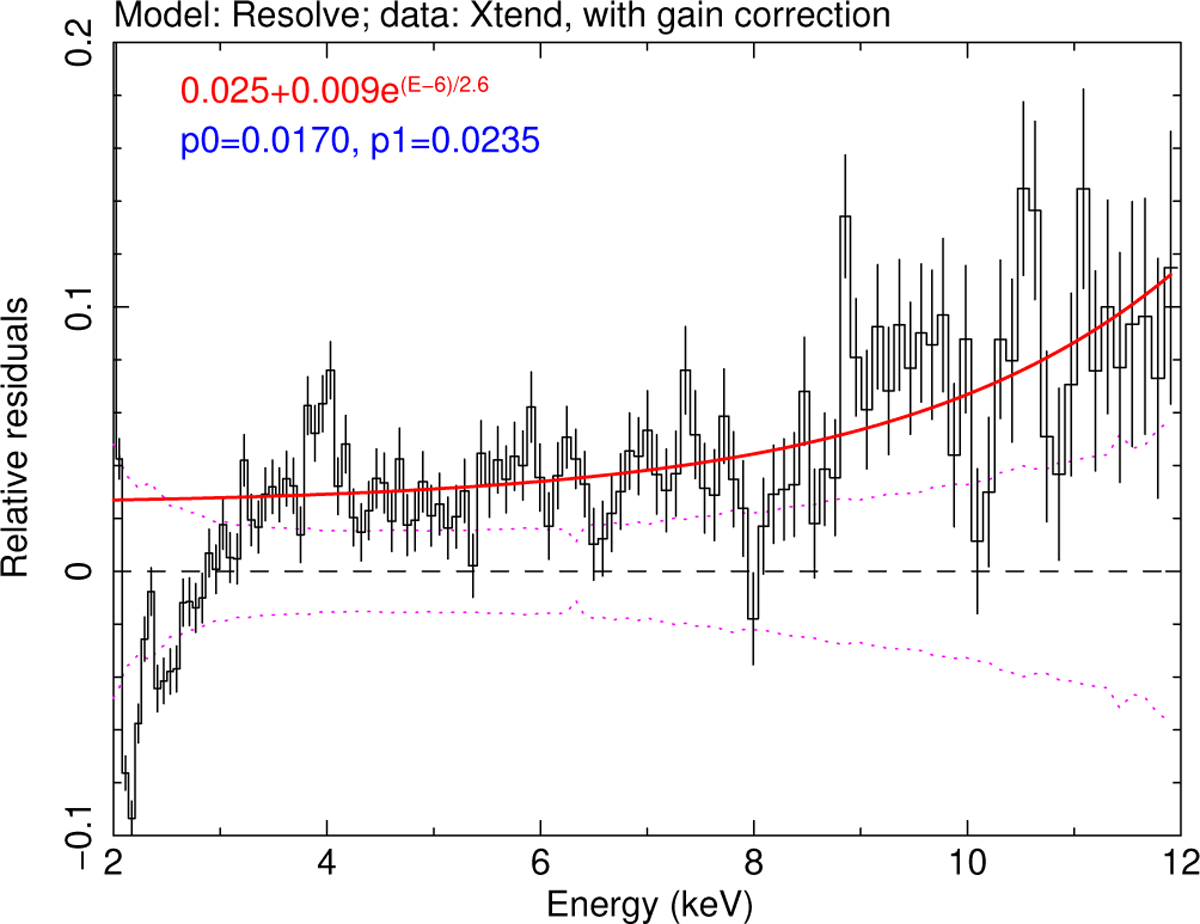
Fig. 3
Download original image
Residuals of the Xtend spectrum relative to the Resolve model (black). The red line is a simple analytical representation of these residuals. The dotted purple lines indicate the 1σ combined statistical uncertainty of the Resolve spectra of NGC 3783, binned to the energy grid of the Xtend data. They represent a systematic uncertainty of the spline model for Resolve.
Current usage metrics show cumulative count of Article Views (full-text article views including HTML views, PDF and ePub downloads, according to the available data) and Abstracts Views on Vision4Press platform.
Data correspond to usage on the plateform after 2015. The current usage metrics is available 48-96 hours after online publication and is updated daily on week days.
Initial download of the metrics may take a while.