Fig. 6
Download original image
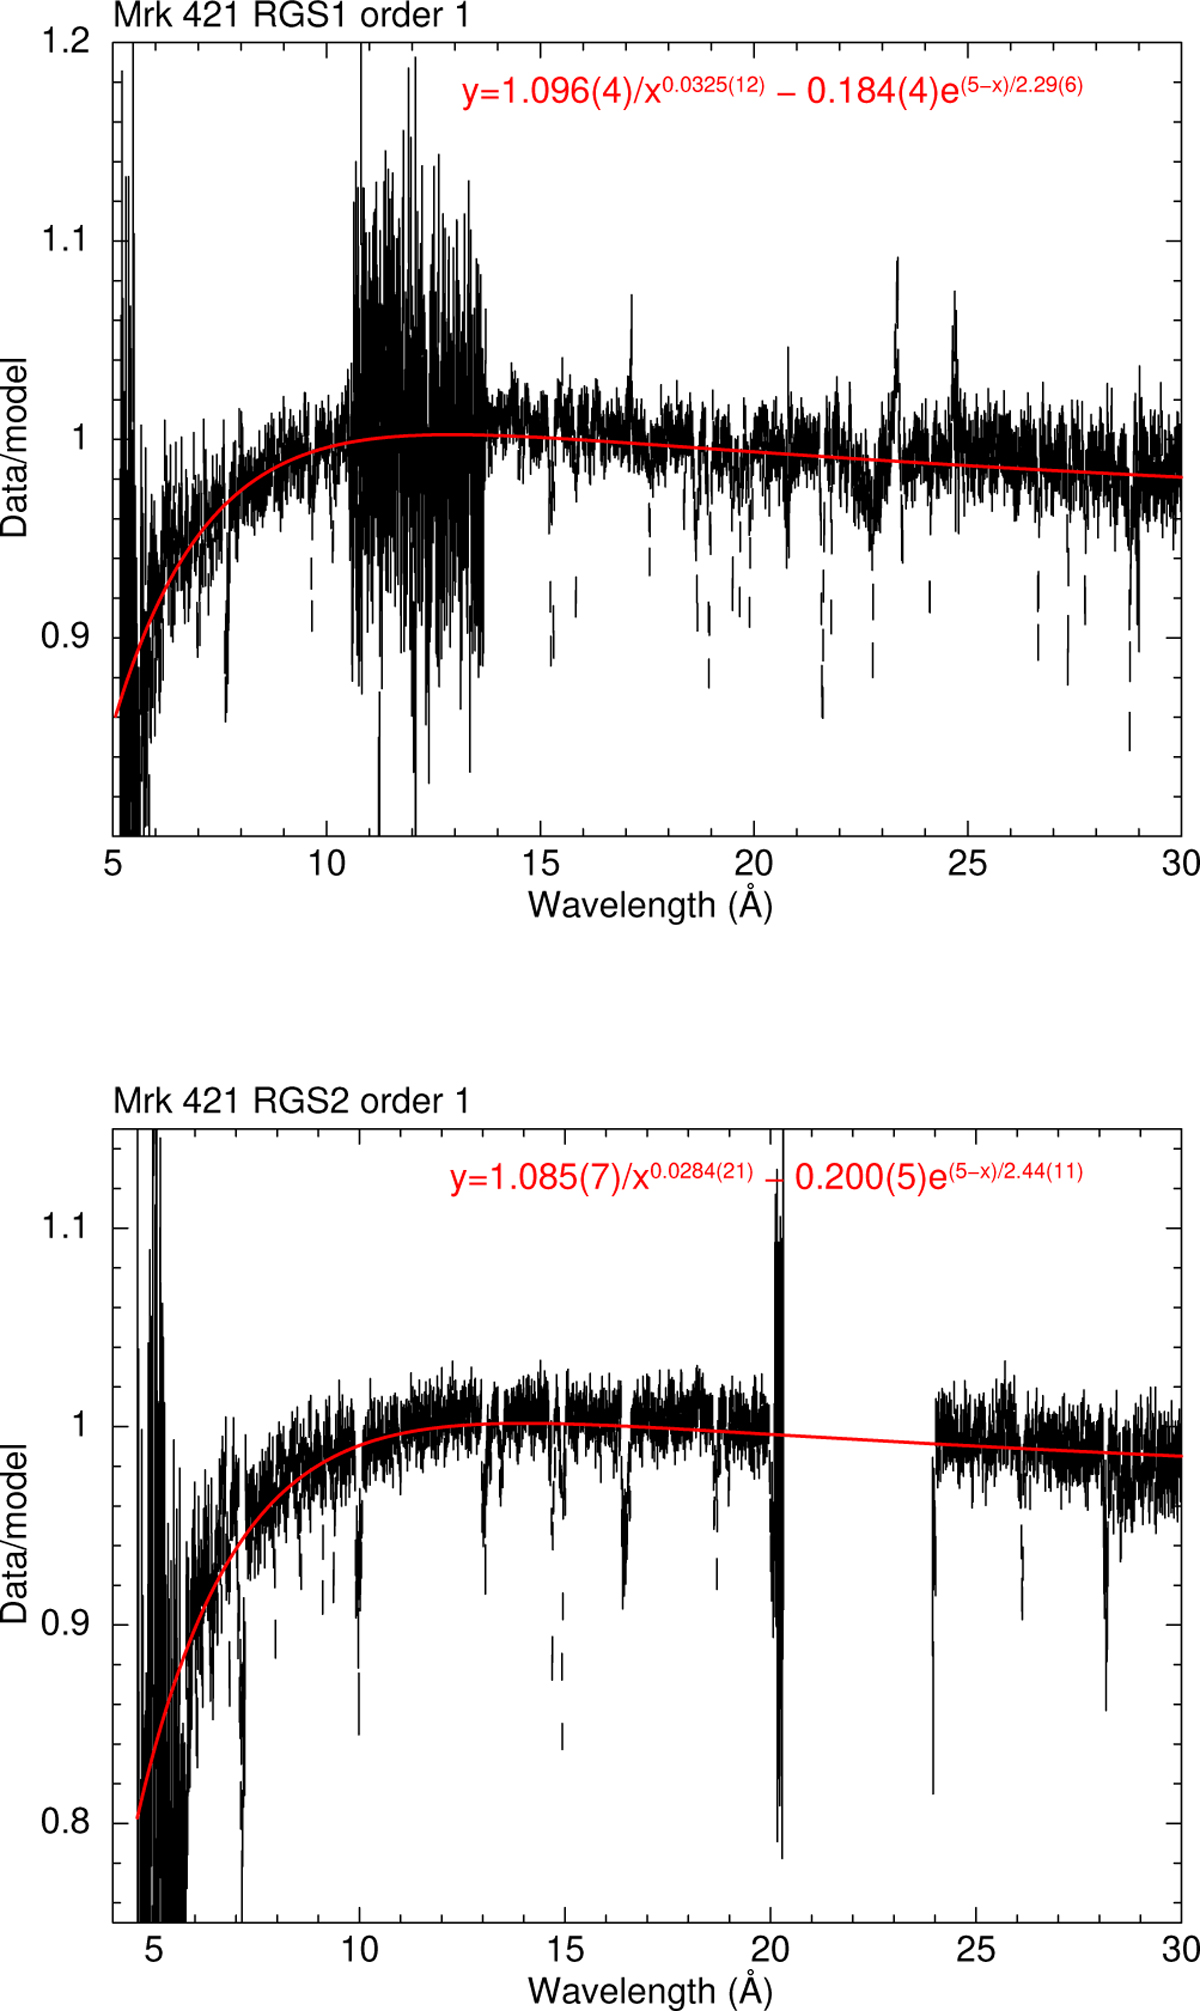
Stacked residuals of Mrk 421 RGS1 and RGS2 spectra as described in the text. Here x represents the wavelength in Å, and y the data/model ratio. The red curves show a simple analytical model for these residuals, with shape and parameters shown in red in the insets. Negative outliers are associated with the hot or bad pixels that are not perfectly taken into account in the simplified stacking procedure.
Current usage metrics show cumulative count of Article Views (full-text article views including HTML views, PDF and ePub downloads, according to the available data) and Abstracts Views on Vision4Press platform.
Data correspond to usage on the plateform after 2015. The current usage metrics is available 48-96 hours after online publication and is updated daily on week days.
Initial download of the metrics may take a while.