Fig. 11.
Download original image
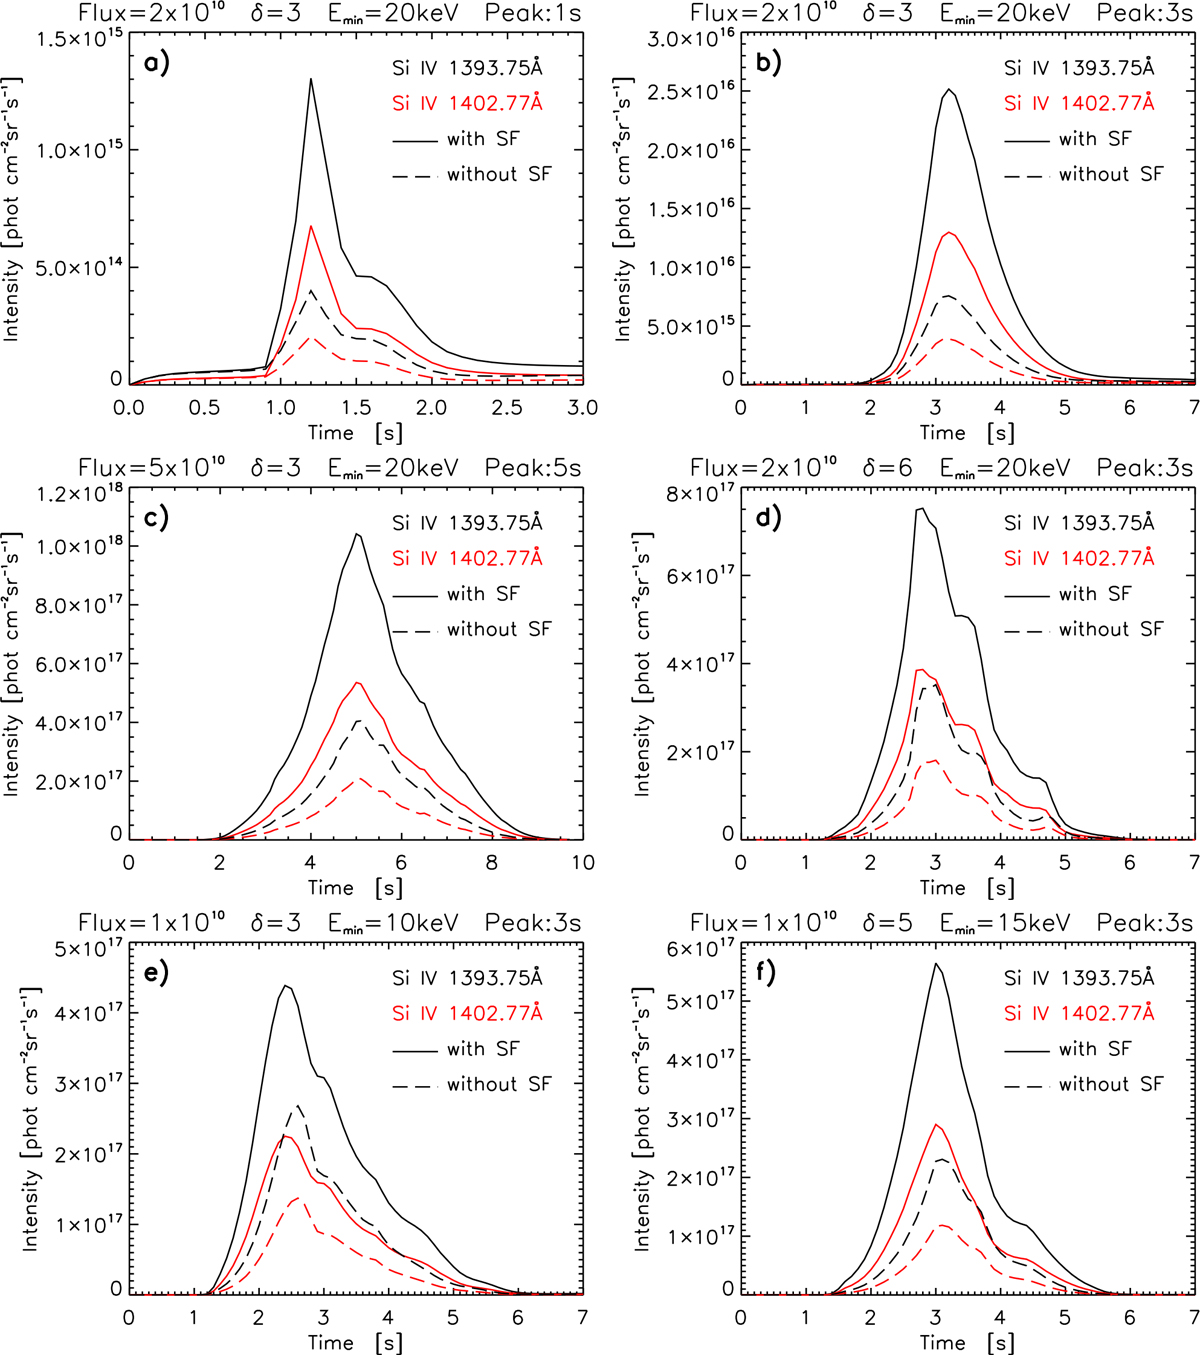
Time evolution of total Si IV 1402.77 Å intensity calculated assuming optically thin plasma and for different models. Details are given in the titles of panels and the arrangement of the panels, parameters, and their units is the same as in Fig. 3. Black lines correspond to the Si 1393.75 Å line and red lines to the 1402.77 Å line. Dashed lines show total intensities calculated without density suppression of dielectronic recombination.
Current usage metrics show cumulative count of Article Views (full-text article views including HTML views, PDF and ePub downloads, according to the available data) and Abstracts Views on Vision4Press platform.
Data correspond to usage on the plateform after 2015. The current usage metrics is available 48-96 hours after online publication and is updated daily on week days.
Initial download of the metrics may take a while.