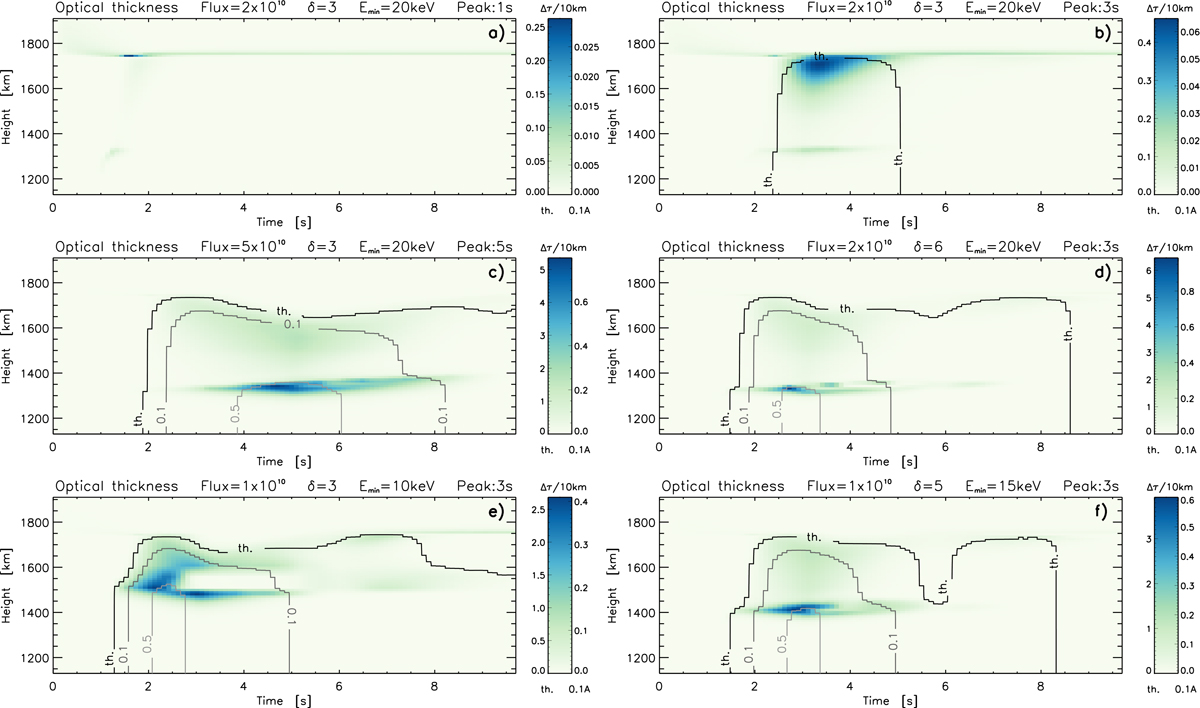
Fig. 13.
Download original image
Changes of Δτ per 10 km for different models. Details are given in the title of panels and the arrangement of panels, parameters, and their units are the same as in Fig. 3. Thick black contour shows level τ = 1 for thermal Doppler width, a thin black line for 0.1 Å Doppler width and a grey line for 0.5 Å. Labels on the left side of the color scale correspond to thermal width and on the right side to 0.1 Å.
Current usage metrics show cumulative count of Article Views (full-text article views including HTML views, PDF and ePub downloads, according to the available data) and Abstracts Views on Vision4Press platform.
Data correspond to usage on the plateform after 2015. The current usage metrics is available 48-96 hours after online publication and is updated daily on week days.
Initial download of the metrics may take a while.