Fig. A.1
Download original image
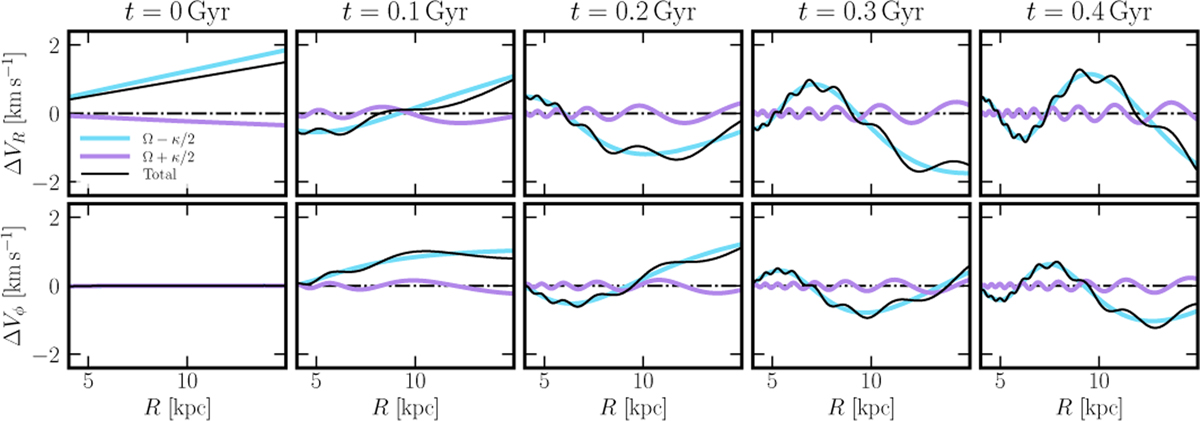
Radial profiles of velocity perturbations ∆VR (top row) and ∆Vϕ (bottom row) for the small, distant, m = 2 kinematic kick simulation (Sect. 2.1), as a function of R, at four different times, at ϕ = 0°. In each panel, the blue line represents the contribution from the Ω − κ/2 wave, the purple line represents the Ω + κ/2 wave, and the black line is the sum of these two modes, which corresponds to the total velocity perturbation at that radius. The initial kick (t = 0 Gyr) decomposes into the two modes. As time evolves, the Ω − κ/2 mode remains dominant and shapes the overall perturbation pattern, while the Ω + κ/2 mode appears as smaller-scale radial oscillations on top of it.
Current usage metrics show cumulative count of Article Views (full-text article views including HTML views, PDF and ePub downloads, according to the available data) and Abstracts Views on Vision4Press platform.
Data correspond to usage on the plateform after 2015. The current usage metrics is available 48-96 hours after online publication and is updated daily on week days.
Initial download of the metrics may take a while.