Open Access
Fig. C.1
Download original image
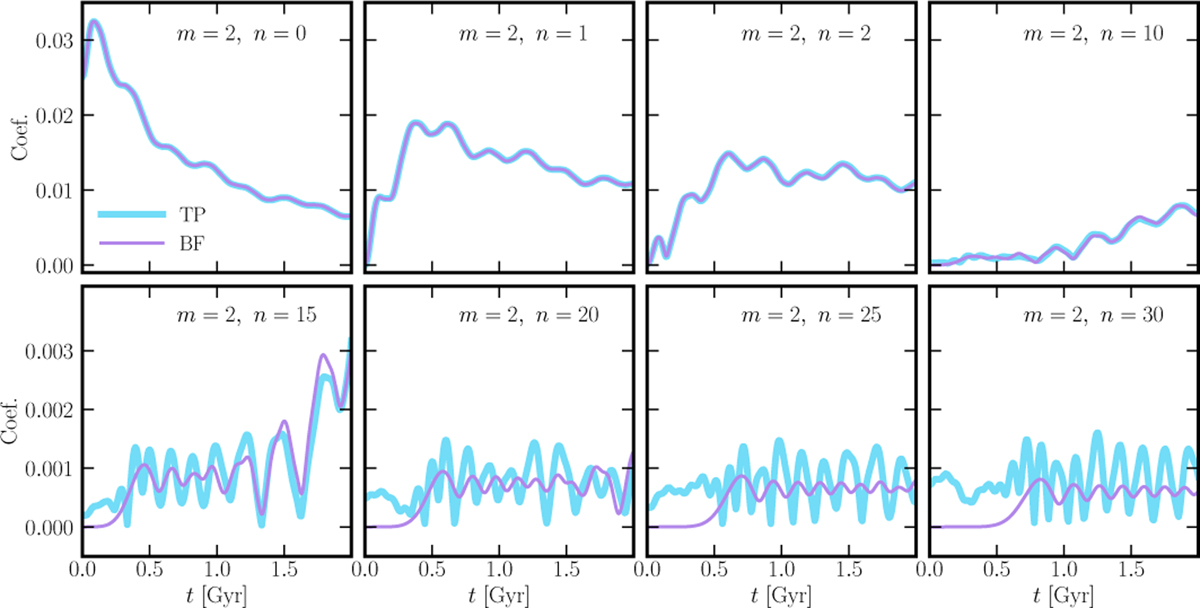
Temporal series of the basis function coefficients after a small m = 2 impact (Sect. 2). In blue, we show the basis function coefficient at each snapshot of the test particle simulation. In purple, we initialize the coefficients αm,n(t = 0) and βm,n(t = 0) analytically and evolve them using Eq. C.10.
Current usage metrics show cumulative count of Article Views (full-text article views including HTML views, PDF and ePub downloads, according to the available data) and Abstracts Views on Vision4Press platform.
Data correspond to usage on the plateform after 2015. The current usage metrics is available 48-96 hours after online publication and is updated daily on week days.
Initial download of the metrics may take a while.