Fig. 2
Download original image
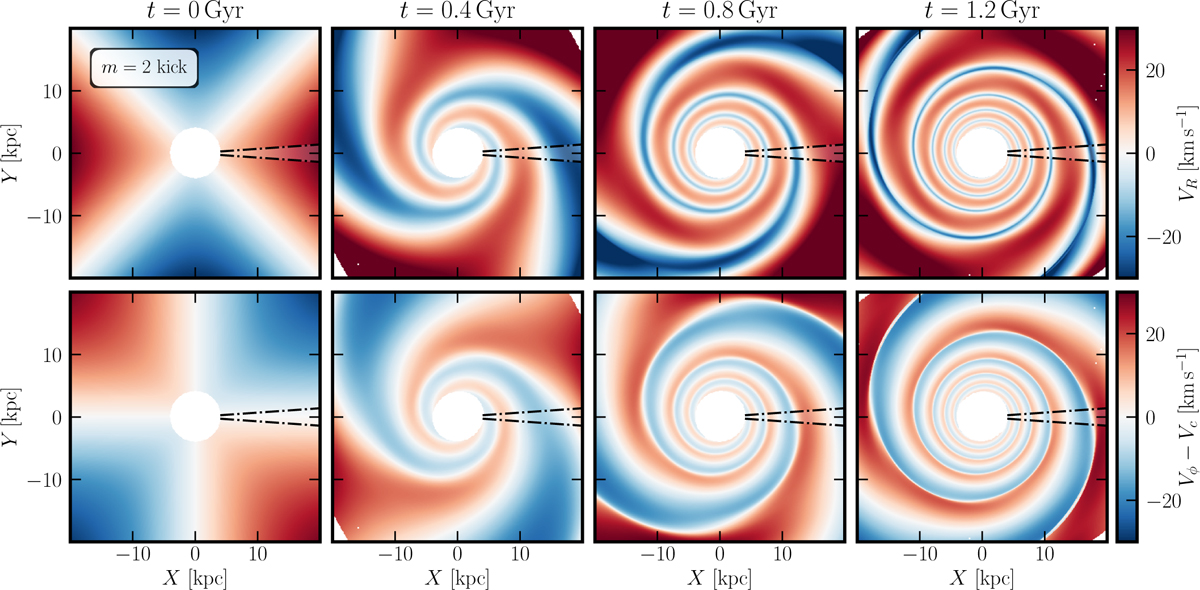
Evolution of the test-particle system after a large, m = 2 impact, designed with a γ correction (Eq. (6)) to excite a single spiral pattern. These panels show snapshots of the velocity field at four different times (t = 0, 0.4, 0.8, and 1.2 Gyr). The top row shows the radial velocity VR, and the bottom row shows the residual azimuthal velocity, ∆Vϕ = Vϕ − Vc. The spiral pattern winds up over time at the expected rate Ω − κ/m. The large amplitude of the perturbation introduces non-linear effects, causing the regions of negative VR (blue) to become more concentrated into arcs, and producing sharp sign changes in ∆Vϕ. One-dimensional (1D) radial profiles extracted from these maps along ϕ = 0° (dash-dot regions) are presented in Figure 3.
Current usage metrics show cumulative count of Article Views (full-text article views including HTML views, PDF and ePub downloads, according to the available data) and Abstracts Views on Vision4Press platform.
Data correspond to usage on the plateform after 2015. The current usage metrics is available 48-96 hours after online publication and is updated daily on week days.
Initial download of the metrics may take a while.