Fig. 3
Download original image
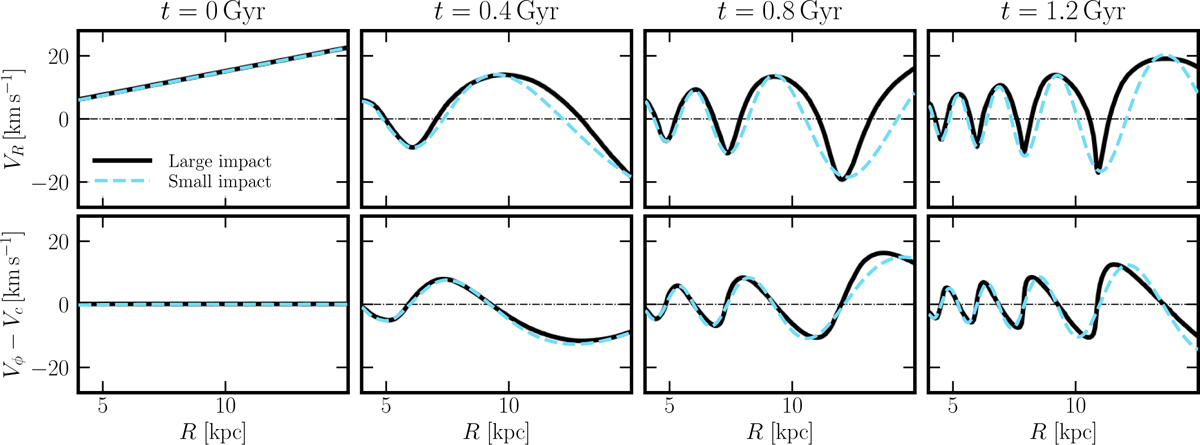
1D radial profiles of the velocity perturbations resulting from the large, m = 2 impact simulation shown in Figure 2. These profiles show VR (top row) and ∆Vϕ (bottom row) as a function of radius R, at the same four times (t = 0, 0.4, 0.8, and 1.2 Gyr). The profiles are averaged on small radial bins at fixed azimuth (ϕ = 0°, corresponding to the dashed-dot regions in Figure 2). The solid black lines represent the results from the large impact simulation. The dashed blue lines show the velocity profiles resulting from the dominant Ω − κ/m wave (specifically the Ω − κ/2 wave for m = 2) in a small impact simulation (extracted from the blue curves in Fig. A.1), scaled up for comparison. These black 1D profiles reveal the characteristic triangular wave shape in VR and the sawtooth pattern in ∆Vϕ, which are key signatures of the non-linear velocity structures generated by the large initial perturbation.
Current usage metrics show cumulative count of Article Views (full-text article views including HTML views, PDF and ePub downloads, according to the available data) and Abstracts Views on Vision4Press platform.
Data correspond to usage on the plateform after 2015. The current usage metrics is available 48-96 hours after online publication and is updated daily on week days.
Initial download of the metrics may take a while.