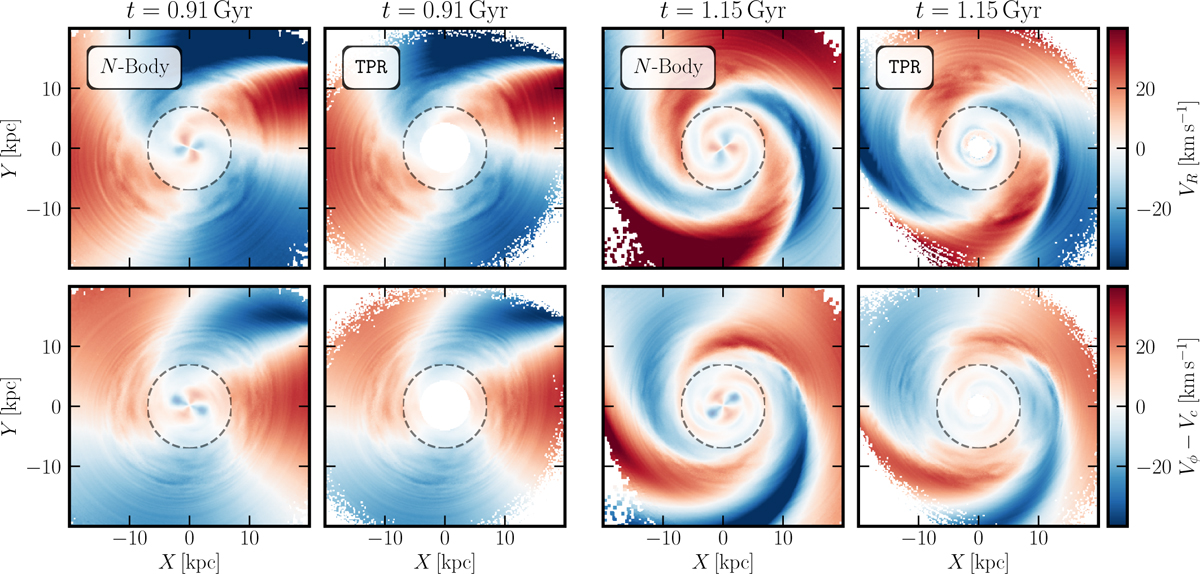
Fig. 7

Download original image
Kinematic maps comparing the evolution of velocity fields in the N-body (first and third columns) and TPR models (second and fourth columns). The panels show snapshots of the radial velocity VR (top row) and the azimuthal velocity perturbation ∆Vϕ (bottom row) in the X–Y plane at two different times. The dashed circle denotes the inner region (R < 7 kpc) that was excluded from the analysis. Observe the winding of the spiral patterns over time and the overall similarity between the N-body and TPR models, with subtle differences, particularly in the amplitude of the kinematic waves.
Current usage metrics show cumulative count of Article Views (full-text article views including HTML views, PDF and ePub downloads, according to the available data) and Abstracts Views on Vision4Press platform.
Data correspond to usage on the plateform after 2015. The current usage metrics is available 48-96 hours after online publication and is updated daily on week days.
Initial download of the metrics may take a while.


