Fig. 8
Download original image
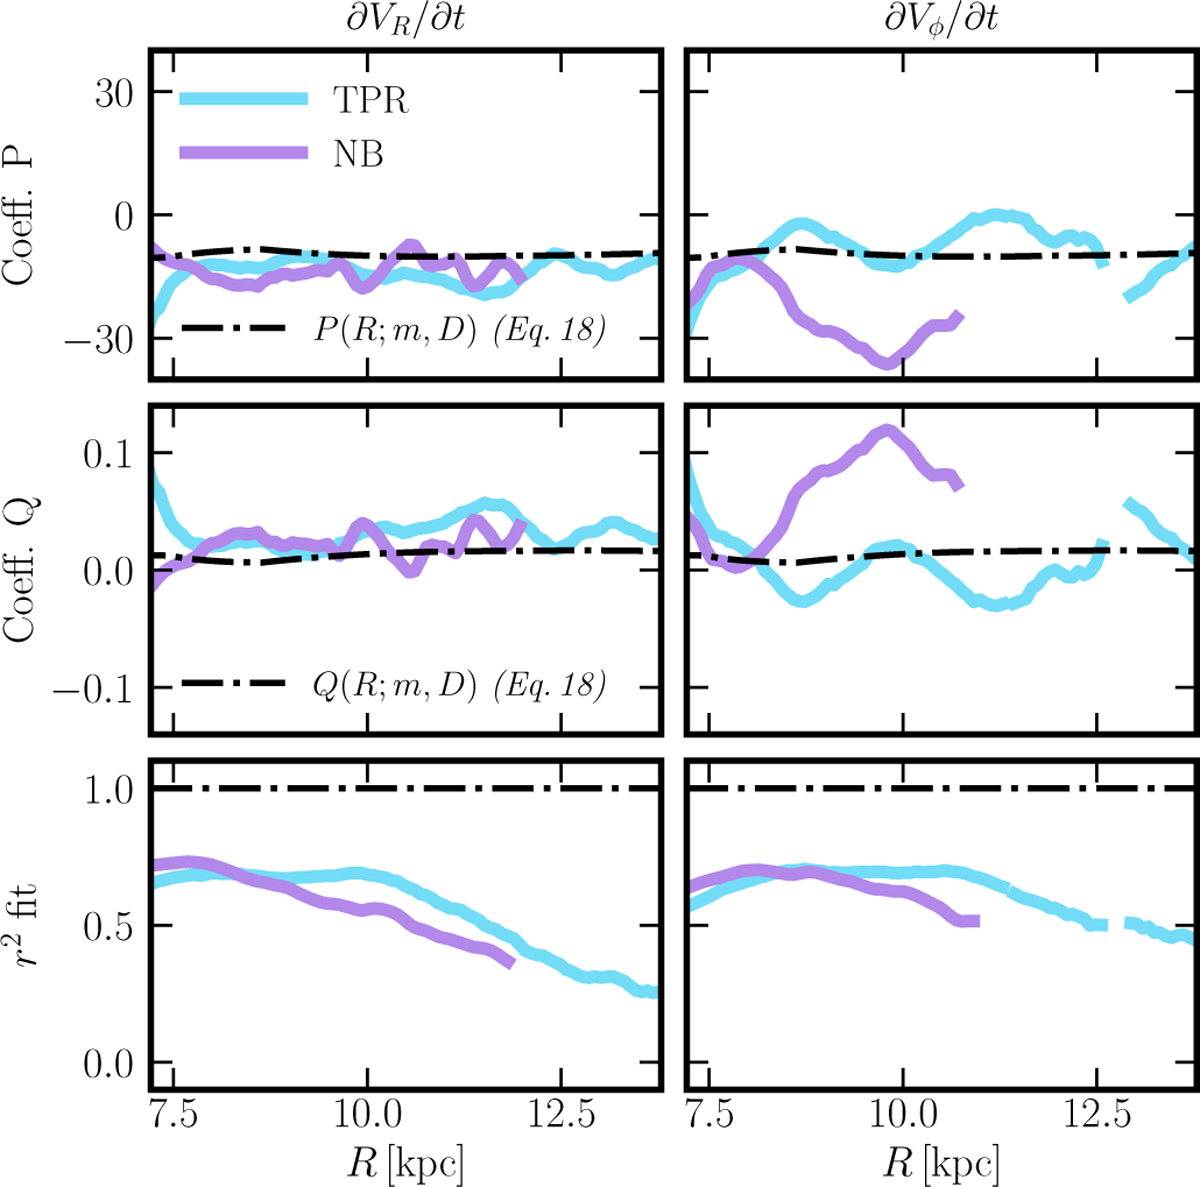
Results from applying SINDy to the TPR (blue lines) and N-body (purple lines) models. The top row shows the SINDy-recovered coefficient P, and the middle row shows coefficient Q, both as a function of R. The bottom row shows the r2 value, indicating the goodness-of-fit for the SINDy model at each radius. The black dash-dotted lines represent the analytical predictions for P and Q (Eq. (18)). The coefficients P and Q obtained by fitting the radial derivative (∂VR/∂t) and the azimuthal derivative (∂Vϕ/∂t) are shown in the left and right columns, respectively. Voids in the curves correspond to radii where SINDy failed to find a solution.
Current usage metrics show cumulative count of Article Views (full-text article views including HTML views, PDF and ePub downloads, according to the available data) and Abstracts Views on Vision4Press platform.
Data correspond to usage on the plateform after 2015. The current usage metrics is available 48-96 hours after online publication and is updated daily on week days.
Initial download of the metrics may take a while.