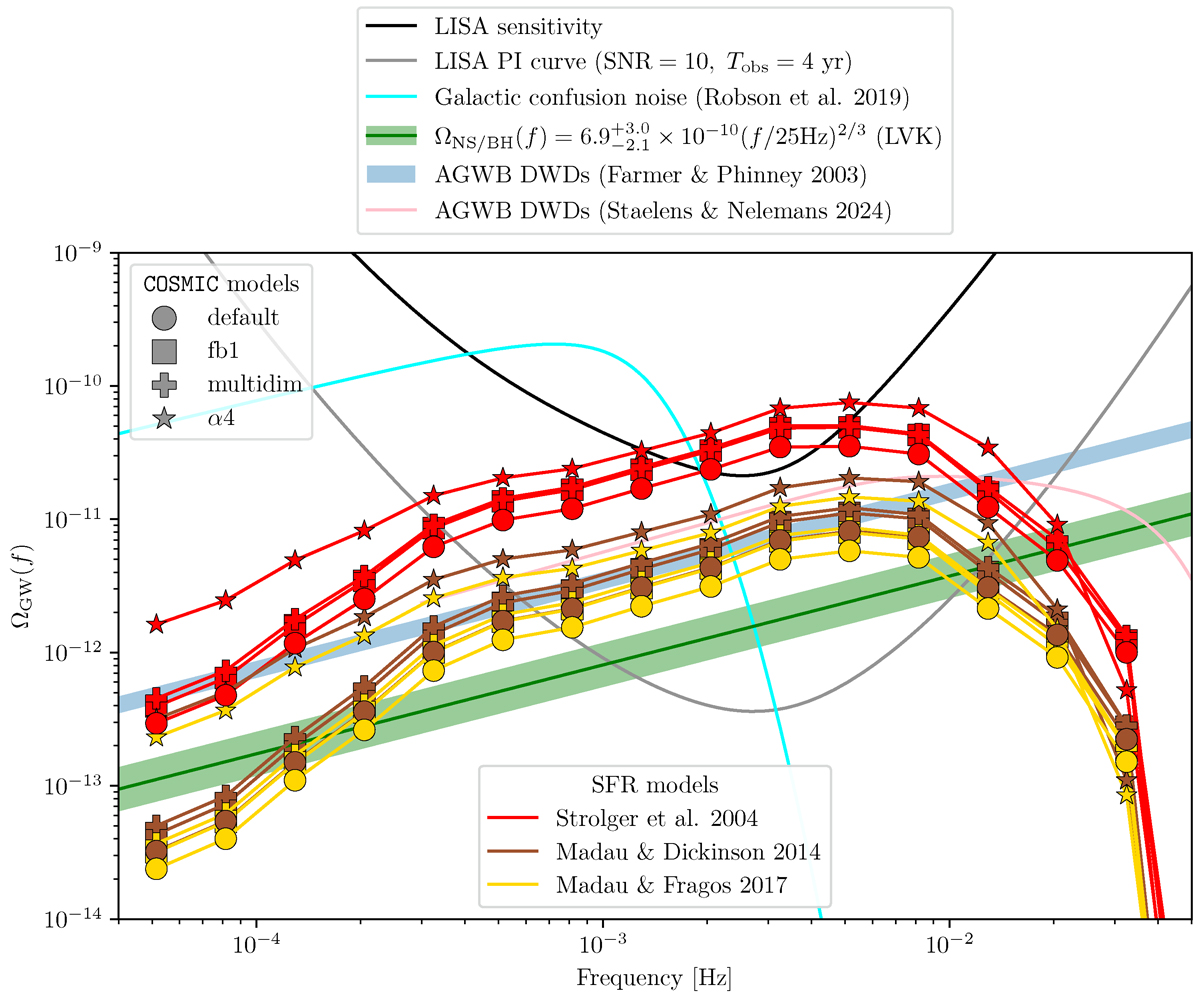
Fig. 1.
Download original image
Spectral energy density of the SGWB from extragalactic DWDs for various population synthesis models (see Sect. 2.3) and various SFRD models (see Sect. 2.4.1). The different population synthesis models are indicated with the same markers as in Fig. A.3. Dotted, solid, and dashed lines correspond to the SFR models from Strolger et al. (2004), Madau & Dickinson (2014), and Madau & Fragos (2017) respectively. The black line represents the LISA sensitivity curve (Colpi et al. 2024), while the gray one shows the PI curve (Thrane & Romano 2013) for four years of observation time and S/N = 10. The light blue curve is the confusion noise from Galactic DWDs (Robson et al. 2019) and the green green band is the 90% credible interval of the SGWB from all compact object binaries estimated from observations of GWs (Abbott et al. 2023). As a comparison, the shaded blue band shows the SGWB from extragalactic DWDs estimated in (Farmer & Phinney 2003) and the pink curve indicates the best-fit model obtained in (Staelens & Nelemans 2024). In Appendix B, we discuss and summarize the fits of SGWB from extragalactic DWDs of all SFR models and stellar population synthesis models as presented in Table B.1.
Current usage metrics show cumulative count of Article Views (full-text article views including HTML views, PDF and ePub downloads, according to the available data) and Abstracts Views on Vision4Press platform.
Data correspond to usage on the plateform after 2015. The current usage metrics is available 48-96 hours after online publication and is updated daily on week days.
Initial download of the metrics may take a while.