Fig. 5.
Download original image
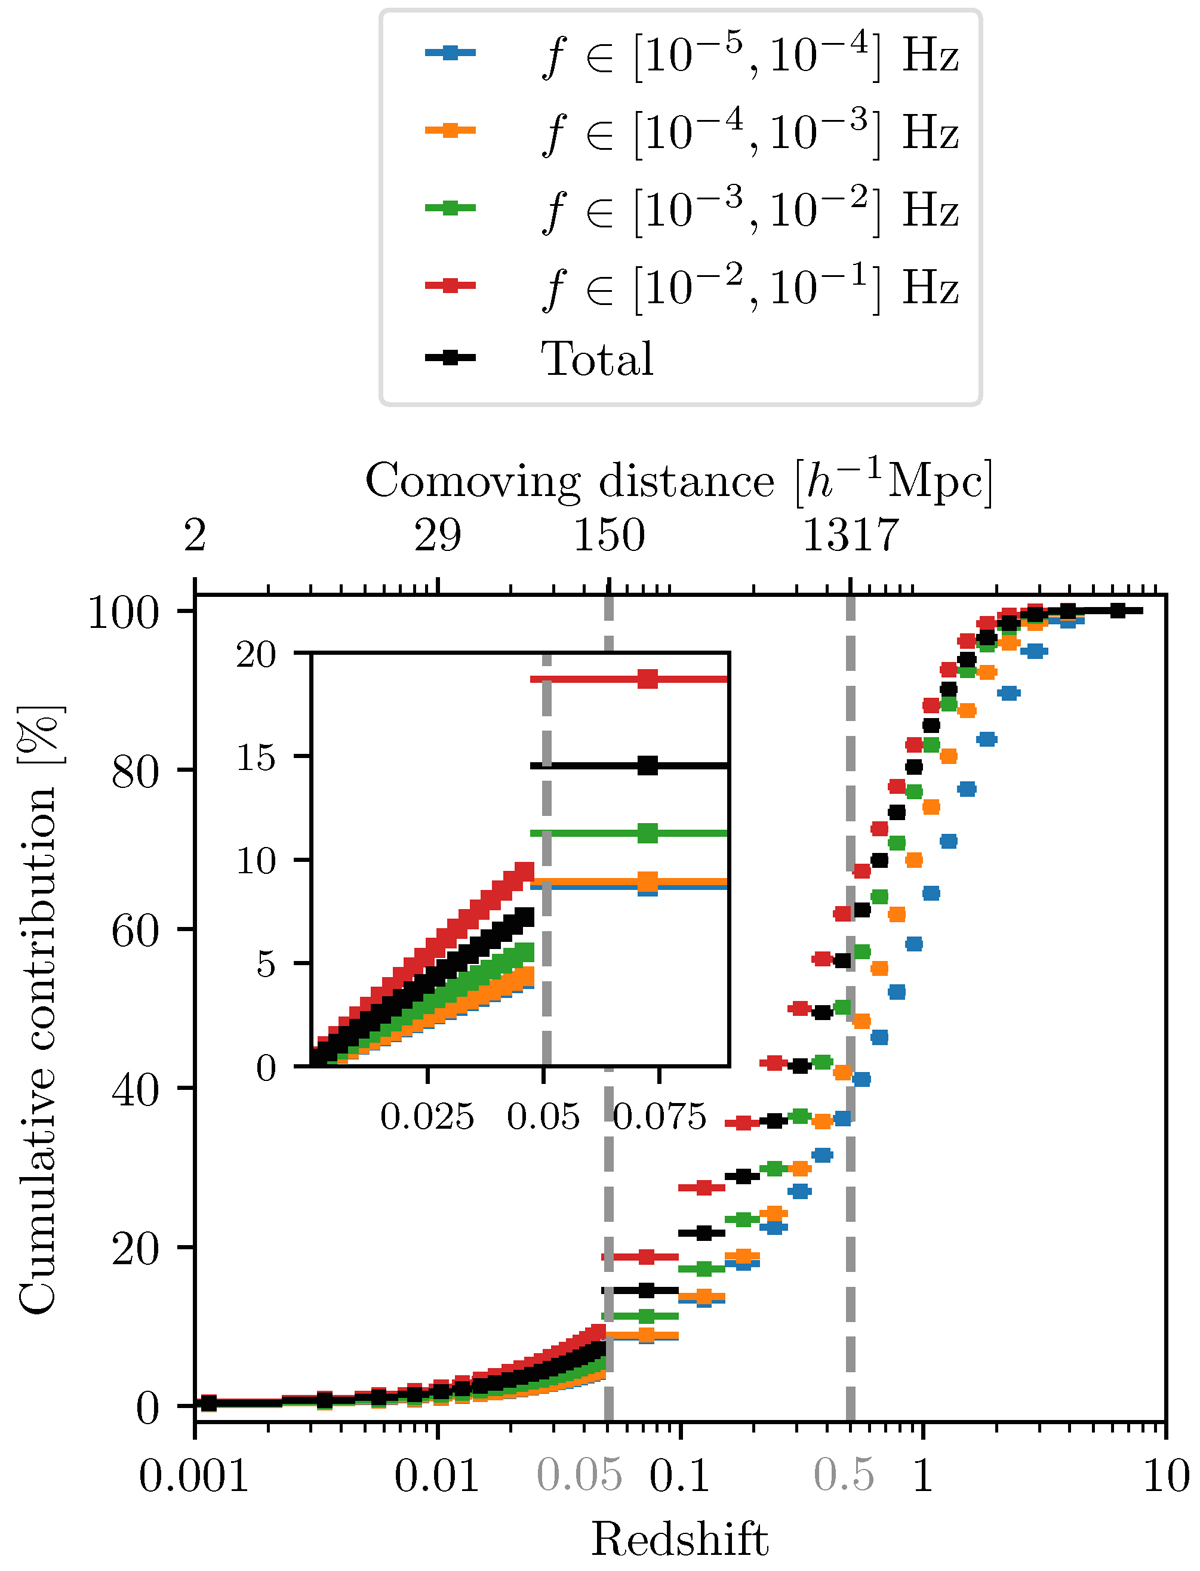
Cumulative contribution of extragalactic DWDs to the SGWB as a function of redshift, using our default population synthesis model and the SFRD from Madau & Dickinson (2014). The black dots represent the integrated contribution over the complete frequency range, and the colored ones correspond to different specific frequency bands. The redshift marking the limit of the homogeneous isotropic Universe z = 0.05 is indicated as the vertical dashed gray line, as is z = 0.5.
Current usage metrics show cumulative count of Article Views (full-text article views including HTML views, PDF and ePub downloads, according to the available data) and Abstracts Views on Vision4Press platform.
Data correspond to usage on the plateform after 2015. The current usage metrics is available 48-96 hours after online publication and is updated daily on week days.
Initial download of the metrics may take a while.