Fig. 1.
Download original image
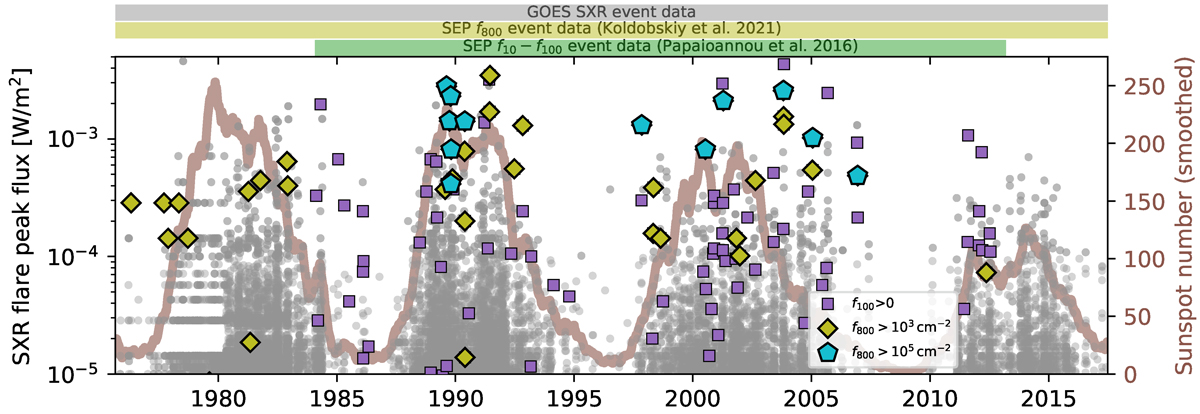
Datasets used in this study. Grey dots indicate SXR flares of ≥M1 class registered between September 1975 and June 2017. Purple squares, olive diamonds, and cyan pentagrams denote flares associated with SEP events with fluences of f100 > 0, f800 > 103, and 105 cm−2, respectively. The brown line shows the smoothed international sunspot number (version 2). The horizontal bars on the top indicate the coverage of SXR, f10 – f100, and f800 SEP data.
Current usage metrics show cumulative count of Article Views (full-text article views including HTML views, PDF and ePub downloads, according to the available data) and Abstracts Views on Vision4Press platform.
Data correspond to usage on the plateform after 2015. The current usage metrics is available 48-96 hours after online publication and is updated daily on week days.
Initial download of the metrics may take a while.