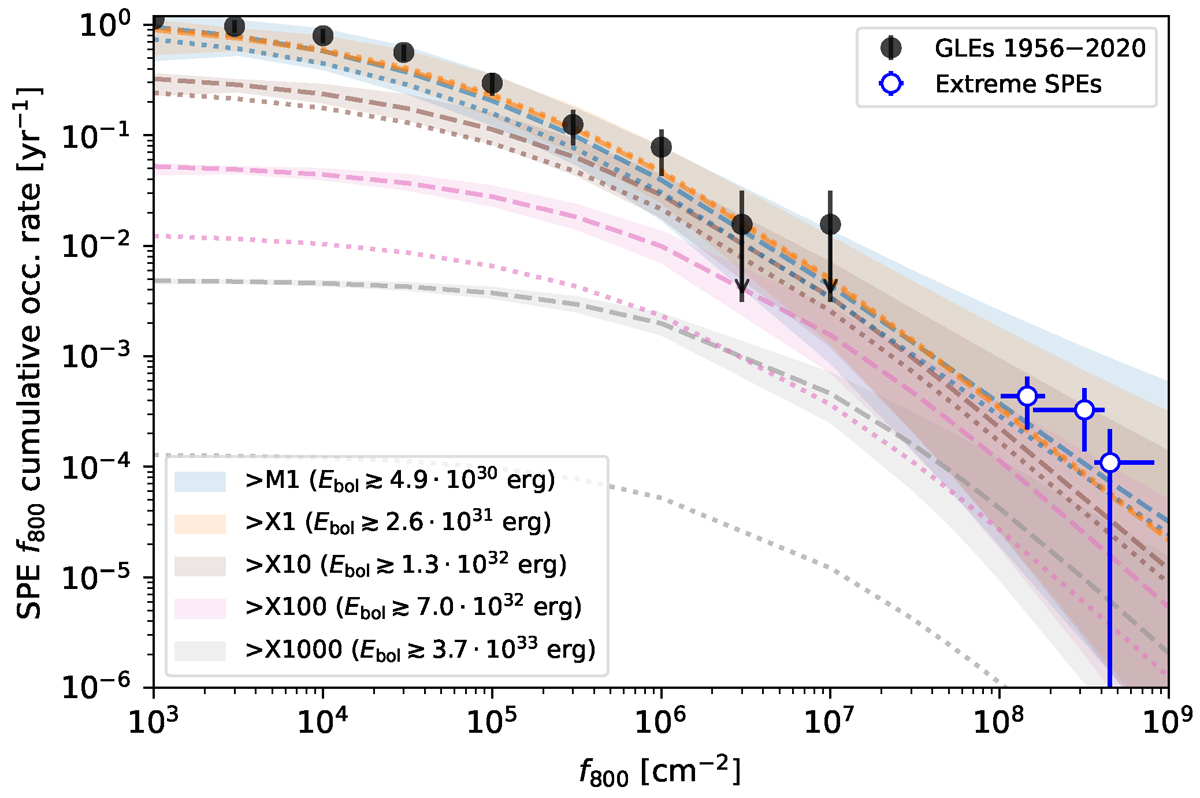
Fig. 3.

Download original image
SPE f800 fluence cumulative occurrence rate. Flares with the peak SXR flux exceeding the given GOES class are shown with different colours. Black and open blue dots represent statistics of the observed GLEs and ESPEs, respectively. Coloured dashed and dotted lines correspond to S23 power-law and Weibull approximations, respectively (see Figure A.1), and the CCP shown in Figure D.1. Shaded areas represent a 1σ uncertainty.
Current usage metrics show cumulative count of Article Views (full-text article views including HTML views, PDF and ePub downloads, according to the available data) and Abstracts Views on Vision4Press platform.
Data correspond to usage on the plateform after 2015. The current usage metrics is available 48-96 hours after online publication and is updated daily on week days.
Initial download of the metrics may take a while.


