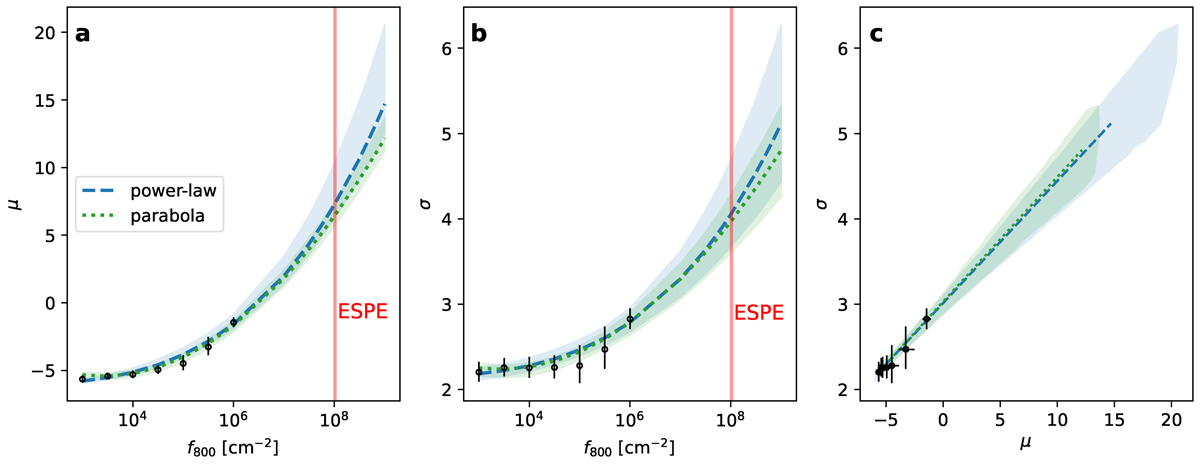
Fig. C.1.
Download original image
Extrapolation of lognormal CDF parameters μ and σ (Equation B.1) towards ESPEs. The best-fit values of μ and σ for given values of f800 and their 1σ uncertainties are shown by black points with error bars in panels a and b, while panel c shows their mutual relation. Blue and green colours correspond to the fit of μ and σ as functions of f800 performed with the MCMC approach for the offset power-law and parabolic functional forms (see Table C.1), respectively. Shaded areas correspond to 68% CrI of the fit, while the lines correspond to the median values within these CrIs. The boundary of the ESPE definition (f800 > 108 cm−2) is shown with the red vertical ESPE line.
Current usage metrics show cumulative count of Article Views (full-text article views including HTML views, PDF and ePub downloads, according to the available data) and Abstracts Views on Vision4Press platform.
Data correspond to usage on the plateform after 2015. The current usage metrics is available 48-96 hours after online publication and is updated daily on week days.
Initial download of the metrics may take a while.