Fig. 1
Download original image
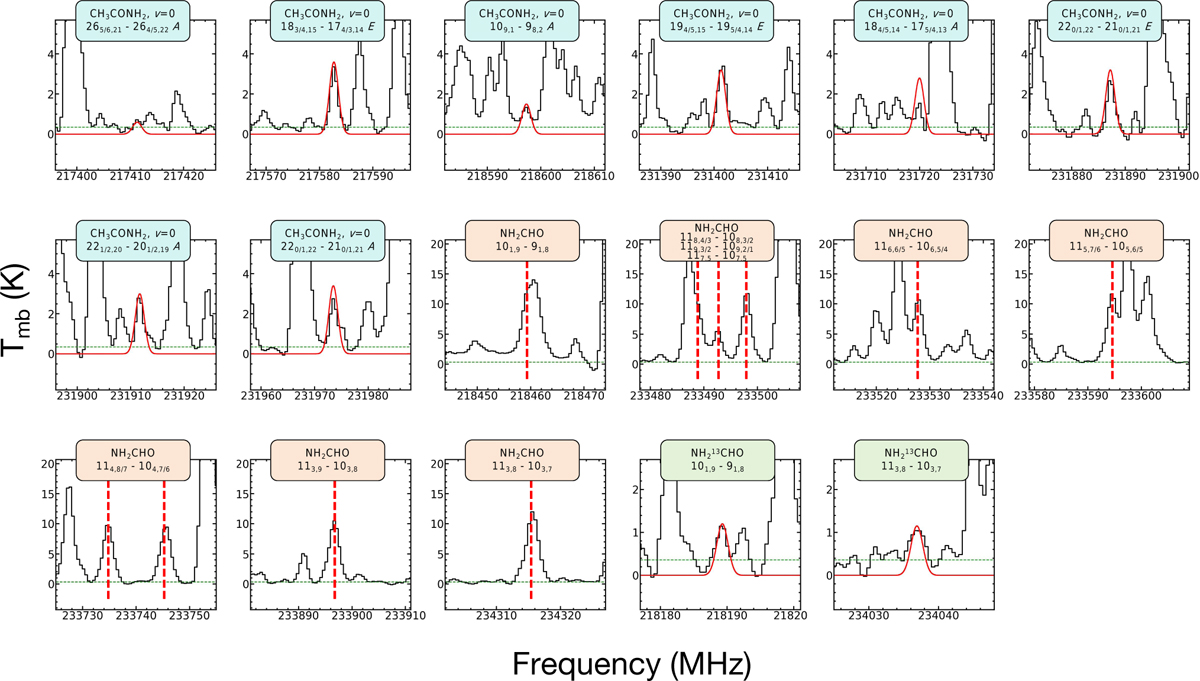
Observed (black) and modeled (red) spectra of CH3CONH2, NH2CHO, and NH213CHO in I17175 MM2. Clearly resolved or slightly blended transitions are shown. Dashed green lines mark the 3σ noise level. No modeled spectrum is shown for NH2CHO due to optical thickness. Dashed red lines indicate the rest frequencies of NH2CHO transitions. Spectra for other sources are shown in Fig. B.1.
Current usage metrics show cumulative count of Article Views (full-text article views including HTML views, PDF and ePub downloads, according to the available data) and Abstracts Views on Vision4Press platform.
Data correspond to usage on the plateform after 2015. The current usage metrics is available 48-96 hours after online publication and is updated daily on week days.
Initial download of the metrics may take a while.