| Issue |
A&A
Volume 702, October 2025
|
|
|---|---|---|
| Article Number | A35 | |
| Number of page(s) | 9 | |
| Section | Interstellar and circumstellar matter | |
| DOI | https://doi.org/10.1051/0004-6361/202556073 | |
| Published online | 01 October 2025 | |
The ALMA-QUARKS survey: Extensive detection of acetamide in multiple high-mass star-forming regions
1
School of Chemistry and Chemical Engineering, Chongqing University,
Daxuecheng South Rd. 55,
Chongqing
401331,
PR
China
2
Chongqing Key Laboratory of Chemical Theory and Mechanism, Chongqing University,
Daxuecheng South Rd. 55,
Chongqing
401331,
PR
China
3
Shanghai Astronomical Observatory, Chinese Academy of Sciences,
Nandan Rd. 80,
Shanghai
200030,
PR
China
4
Key Laboratory for Research in Galaxies and Cosmology, Shanghai Astronomical Observatory, Chinese Academy of Sciences,
Nandan Rd. 80,
Shanghai
200030,
PR
China
5
LUX, Observatoire de Paris, PSL Research University, CNRS, Sorbonne Universités,
75014
Paris,
France
6
Department of Astronomy, Peking University,
5 Yiheyuan Road, Haidian District,
Beijing
100871,
PR
China
7
Kavli Institute for Astronomy and Astrophysics,
Peking University, 5 Yiheyuan Road, Haidian District,
Beijing
100871,
PR
China
8
Leiden Observatory, Leiden University,
PO Box 9513,
2300RA
Leiden,
The Netherlands
★ Corresponding authors: This email address is being protected from spambots. You need JavaScript enabled to view it.
; This email address is being protected from spambots. You need JavaScript enabled to view it.
; This email address is being protected from spambots. You need JavaScript enabled to view it.
Received:
24
June
2025
Accepted:
18
August
2025
Abstract
Acetamide (CH3CONH2), a key interstellar amide and a methyl derivative of formamide (NH2CHO), has rarely been detected, limiting insights into its prebiotic relevance. We present the first systematic survey of acetamide toward 52 hot molecular cores using ALMA Band 6 data. We have detected acetamide in ten cores, markedly expanding the inventory of known emitters. The derived column densities of acetamide range from (2.5 ± 0.9) × 1014 to (1.5 ± 0.6) × 1016 cm−2, compared to formamide’s (1.1 ± 0.1) × 1015 to (6.9 ± 0.4) × 1016 cm−2. The nearly constant abundance ratios (~3–9) and strong abundance correlation between the two amides across sources suggest a chemically linked formation pathway, likely on grain surfaces. The presence of peptide-like molecules in these regions implies that complex organic species can survive star formation processes, offering a potential pathway toward prebiotic chemistry. These findings constrain the dominant grain-surface formation routes of acetamide, confirm its broader prevalence in high-mass star-forming regions, and underscore the importance of targeted amide surveys in tracing the chemical evolution toward prebiotic complexity.
Key words: astrochemistry / ISM: abundances / ISM: molecules
© The Authors 2025
 Open Access article, published by EDP Sciences, under the terms of the Creative Commons Attribution License (https://creativecommons.org/licenses/by/4.0), which permits unrestricted use, distribution, and reproduction in any medium, provided the original work is properly cited.
This article is published in open access under the Subscribe to Open model. This email address is being protected from spambots. You need JavaScript enabled to view it. to support open access publication.
1 Introduction
Life on Earth appeared about 700 million years after planetary formation (~3.8 billion years ago; Pearce et al. 2018), yet the mechanisms driving its origin remain unknown. What is clear is that life depends on recurring chemical motifs. Among them, the amide functional group (−NH−C(O)−) is central to peptide bonds and essential for biochemistry (Pauling et al. 1951).
Understanding how amides appeared on early Earth is vital for tracing the chemical origin of life. While they may have formed through prebiotic processes on Earth (Patel et al. 2015), an alternative scenario involves their formation in space and subsequent delivery by meteorites or comets (Chyba et al. 1990; Chyba & Sagan 1992). Such molecules could have originated in the interstellar medium (ISM), within the parental molecular cloud of the Solar System. This raises the possibility that analogous prebiotic pathways operate in other planetary systems across the Milky Way.
To assess the prebiotic chemistry relevance of amides, it is crucial to determine their presence in star- and planet-forming regions. Formamide (NH2CHO), the simplest amide and a key prebiotic precursor, has been widely detected across various astrophysical environments (see, e.g., Zheng et al. 2024; Zeng et al. 2023; Liu et al. 2022; Ligterink et al. 2020, and the review by López-Sepulcre et al. 2019 for a comprehensive list of observations). Recent observations further confirmed its prevalence in star-forming regions (Xu et al. 2025). In contrast, acetamide (CH3CONH2), a methylated derivative of formamide that represents a potential step toward more complex biomolecules, has been detected in only a handful of star-forming regions, including Sgr B2 (Hollis et al. 2006; Halfen et al. 2011; Belloche et al. 2017; Zheng et al. 2024), NGC 6334I (Ligterink et al. 2020), G31.41+0.31 (Colzi et al. 2021), and Orion KL (Cernicharo et al. 2016), as well as the intermediate-mass protostar Serpens SMM1-a (Ligterink et al. 2022) and the low-mass protostar IRAS 16293-2422B (Ligterink et al. 2017). Notably, no large-sample survey has yet confirmed widespread acetamide emission.
Expanding the number of amide detections is essential in order to evaluate its role in prebiotic chemistry. Although astrochemical models have incorporated potential reaction networks for formamide and acetamide (Belloche et al. 2017, 2019; Garrod et al. 2022), observational constraints – especially for larger amides – remain sparse. To address this gap, we present the first systematic search for acetamide in 52 hot molecular cores (HMCs) using Band 6 observations from the Atacama Large Millimeter/submillimeter Array (ALMA). Our detections substantially increase the number of known acetamide sources, enabling a comparative analysis with formamide. These findings offer new insights into interstellar amide chemistry and its potential connection to prebiotic molecular evolution.
This paper is structured as follows. Section 2 outlines the source sample and the observational setup. Section 3 presents detection results and the derivation of column densities and excitation temperatures. Section 4 discusses chemical correlations and formation pathways. Section 5 summarizes our conclusions.
Parameters of the HMC sample.
2 Observations
This study is based on a sample of HMCs summarized in Table 1. The targets were selected from the Querying Underlying mechanisms of massive star formation with ALMA-Resolved gas Kinematics and Structures (QUARKS) survey (Liu et al. 2024) based on HMC candidates previously identified by Qin et al. (2022). QUARKS is a 1.3 mm follow-up to the ALMA Three-millimeter Observations of Massive Star-forming Regions (ATOMS; Liu et al. 2020) and its goal is to resolve substructures within 3 mm core clusters in massive star-forming clumps (Liu et al. 2020).
The QUARKS survey was conducted with the Atacama Compact 7 m Array (ACA) and 12 m arrays at Band 6 toward 139 protoclusters from October 2021 to June 2024. Further details on the observational setup and data reduction are provided in Liu et al. (2024). Briefly, the combined ACA and 12 m array C-2 configuration dataset of this work yields an angular resolution of ~1.3″ and a typical rms noise level of ~5 mJy beam−1. The flux calibration uncertainty is estimated to be ~10%. Four spectral windows (SPWs 1-4), each with a bandwidth of 1.875 GHz, were centered at 217.918, 220.319, 231.370, and 233.520 GHz. The uniform spectral resolution of 976.56 kHz corresponds to a velocity resolution (δV) of 1.2 km s−1, sufficient to spectrally resolve broad molecular lines.
Parameters of detected amide molecules.
3 Results
3.1 Molecular line identifications
Spectroscopic data for NH2CHO and its 13C isotopolog (NH213CHO) were obtained from the Cologne Database for Molecular Spectroscopy1 (CDMS; Müller et al. 2001, 2005), while data for CH3CONH2 were adopted from Ilyushin et al. (2004). The spectral modeling was performed using GILDAS2 (Grenoble Image and Line Data Analysis Software) to simulate the observed emission, with five parameters: source size, line width, velocity offset, rotational temperature, and column density. Of these, only the rotational temperature and column density were treated as free parameters. Source sizes were based on deconvolved continuum angular sizes; line widths were derived via Gaussian fitting; velocity offsets were calibrated using the CH3OH line at 218440.063 MHz. Transitions heavily blended with intense lines from other species were excluded from the fitting. For partially blended transitions, multicomponent Gaussian fitting was applied, and the contribution from overlapping species was estimated and subtracted using the best-fit synthetic spectra based on local thermodynamic equilibrium (LTE) modeling.
Although line intensities peak at the continuum center, strong absorption and line blending complicate the analysis. A detailed line-by-line inspection revealed that most CH3CONH2 transitions are blended with other species near the continuum peak, while NH2CHO transitions suffer from significant absorption against bright continuum emission. To improve line identification in such cases, spectra were extracted from offset positions (as shown in Fig. A.1), where most of the lines exhibit Gaussian profiles and are relatively bright compared to other positions.
CH3CONH2 was considered confidently detected in ten HMCs (see Table 2), each showing at least five unblended transitions with signal-to-noise ratios ≥3σ that match the modeled rest frequencies and intensities. This criterion minimizes contamination from noise or line blending and ensures robust molecular identification. This constitutes the largest known sample of CH3CONH2 detections in HMCs to date and forms the basis for our subsequent analysis. Figure 1 presents representative spectra of CH3CONH2, NH2CHO, and NH213CHO in I17175 MM2, highlighting clearly resolved or slightly blended transitions. Spectra for the other nine sources with CH3CONH2 detections are provided in Fig. B.1. Tables C.1–C.10 list all detected lines for each amide in ten HMCs.
Although several other HMCs also exhibit emission features potentially attributable to CH3CONH2, it is insufficient to claim a secure detection of this species in these sources, as two or fewer unblended transitions are observed. Thus, the focus of this study is solely on the secure detection of CH3CONH2. Sources that lack conclusive evidence of the existence of this species are discussed in Appendix D.
3.2 Molecular parameter calculations
Column densities and excitation temperatures were derived using rotational diagrams for molecules with at least three unblended transitions spanning a broad energy range (Fig. 2). This method was applied to nine sources with CH3CONH2 detections (excluding I18089) and to one source (I18089) with sufficient NH213CHO transitions.
For CH3CONH2 in I18089, the rotational diagram was not employed due to the limited energy range (117.7–136.6 K) of five detected transitions, which precludes a reliable fit. Instead, its column density was estimated from a single unblended line, assuming the excitation temperature derived from NH213CHO in the same source. Similarly, for sources with fewer than three clean NH213CHO transitions, column densities were estimated using individual lines and the excitation temperature obtained from CH3CONH2. Column densities (N) were calculated under the assumptions of LTE and optically thin emission, following the standard rotational diagram formalism (Li et al. 2022):
![Mathematical equation: $\[N_{\mathrm{t}}=\frac{8 \pi k \nu^2}{h c^3 A_{\mathrm{ul}}} \frac{Q}{g_{\mathrm{u}}} e^{E_{\mathrm{u}} / k T_{\mathrm{ex}}} \int T_{\mathrm{mb}} ~d v,\]$](/articles/aa/full_html/2025/10/aa56073-25/aa56073-25-eq1.png) (1)
(1)
where k is the Boltzmann constant, ν the transition frequency, h the Planck constant, c the speed of light, Aul the Einstein emission coefficient, gu the upper level degeneracy, and Eu the upper-level energy. Due to optical thickness of NH2CHO lines, their column densities were instead derived from the optically thin NH213CHO isotopolog, scaled by the appropriate 12C/13C ratio for each source. These ratios were calculated following the equation described by Yan et al. (2023) and are tabulated in Column 8 of Table 1. While this method effectively avoids opacity-related biases, several factors can introduce uncertainties into the observed 12C/13C ratios. As noted by Yan et al. (2023), these include distance effects, beam size variations, excitation temperature mismatches, isotope-selective photodissociation, and chemical fractionation. Although the first three effects are likely minor, the last two can be significant in regions with strong UV fields or nonequilibrium chemistry. For example, isotope-selective photodissociation can enhance the 12C/13C ratio in photon-dominated regions, whereas chemical fractionation can either increase or decrease the abundance of 13C-bearing species depending on formation pathways.
Table 2 summarizes the derived column densities and excitation temperatures, along with abundances relative to CH3OH. The CH3OH column densities were adopted from Qin et al. (2022). Abundances relative to H2 are not reported due to uncertainties in dust opacity. CH3CONH2 column densities range from (2.5 ± 0.9) × 1014 to (1.5 ± 0.6) × 1016 cm−2, with excitation temperatures between 110 and 178 K. NH2CHO exhibits consistently higher column densities, ranging from (1.1 ± 0.1) × 1015 to (6.9 ± 0.4) × 1016 cm−2, typically 3–9 times those of CH3CONH2.
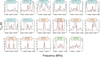 |
Fig. 1 Observed (black) and modeled (red) spectra of CH3CONH2, NH2CHO, and NH213CHO in I17175 MM2. Clearly resolved or slightly blended transitions are shown. Dashed green lines mark the 3σ noise level. No modeled spectrum is shown for NH2CHO due to optical thickness. Dashed red lines indicate the rest frequencies of NH2CHO transitions. Spectra for other sources are shown in Fig. B.1. |
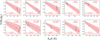 |
Fig. 2 Rotational diagrams of CH3CONH2 and NH213CHO. Black points represent the observed data, while red lines indicate the best-fit results. Shaded red regions denote the associated fitting uncertainties. Each panel includes the source name and molecule in the top-right corner, with the derived rotational temperature (Trot) and column density (N) shown in the bottom-left. |
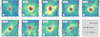 |
Fig. 3 Integrated emission maps of NH2CHO (black) and CH3CONH2 (blue), overlaid with 1.3 mm continuum emission. Contour levels are 10%, 20%, 40%, 60%, and 80% of the peak values. The solid ellipse in the bottom-left corner indicates the synthesized beam for the continuum. |
3.3 Spatial distribution
The spatial distributions of NH2CHO and CH3CONH2 were analyzed using the Cube Analysis and Rendering Tool for Astronomy (CARTA; Comrie et al. 2021) to investigate their morphology and potential chemical link. Figure 3 presents the integrated intensity (moment-0) maps of both molecules overlaid on the 1.3 mm continuum emission. All selected transitions were individually checked to avoid contamination from line blending. Overall, amide emissions appear compact and generally coincide with the continuum peaks across all sources, except for I16164, where spatial offsets are observed. This deviation is consistent with the presence of an ultracompact HII region reported by (Zhang et al. 2023) and similar offsets for other complex organic molecules (COMs) reported in Qin et al. (2022). In all HMCs, CH3CONH2 and NH2CHO show similar spatial distributions, supporting their chemical linkage.
4 Discussion
4.1 Detection and distribution of CH3CONH2
CH3CONH2, a key interstellar amide following NH2CHO, has previously been detected in only a few individual sources. Based on unblended emission features, we report its detection in ten HMCs from the QUARKS sample, significantly increasing the number of known CH3CONH2 emitters in the ISM (Fig. 4). This findings suggests that complex amides are more widespread in star-forming regions than previously recognized, providing new observational constraints on their potential role in prebiotic chemistry.
4.2 Chemical links between NH2CHO and CH3CONH2
To explore potential chemical connections between CH3CONH2 and NH2CHO, their abundances were normalized to CH3OH, a standard reference for COMs in the ISM. For our sources, CH3OH column densities were adopted from Qin et al. (2022). For literature sources, we adopted values from Cernicharo et al. (2016), Bøgelund et al. (2018), Jørgensen et al. (2018), Bonfand et al. (2019), Ligterink et al. (2022), and Mininni et al. (2023), assuming a 20% uncertainty where not specified.
For comparison, we incorporated observational data from both high- and low-mass sources including Sgr B2(N2) (Belloche et al. 2017), G31.41+0.31 (Colzi et al. 2021), Orion KL (Cernicharo et al. 2016), IRAS 16293-2422B (Ligterink et al. 2018), NGC6334I MM1/MM2 (Ligterink et al. 2020), and Serpens SMM1-a (Ligterink et al. 2022), along with relevant chemical models (Garrod et al. 2022) and laboratory experimental result (Ligterink et al. 2018). While NGC6334I MM1/MM2 (Ligterink et al. 2020) correspond to the same physical sources as I17175 MM1/MM2 in our sample, the CH3CONH2 column densities derived in this work are lower, likely due to more offset spectral extraction positions. Despite this, the NH2CHO/CH3CONH2 abundance ratios agree well between the two studies (4.5 for MM1 and 3.0 for MM2 in our work vs. 12.3 for MM1 and 3.1 for MM2 in Ligterink et al. 2020), supporting the reliability of our detections. Therefore, values from NGC 6334I were excluded from further statistical analysis to avoid duplication.
As shown in Fig. 5a, CH3CONH2 and NH2CHO abundances exhibit a strong positive correlation, with a best-fit power law:
![Mathematical equation: $\[X_{\mathrm{CH}_3 \mathrm{OH}}\left(\mathrm{CH}_3 \mathrm{CONH}_2\right)=(0.08 \pm 0.07) \times \mathrm{X}_{\mathrm{CH}_3 \mathrm{OH}}\left(\mathrm{NH}_2 \mathrm{CHO}\right)^{(0.86 \pm 0.15)}.\]$](/articles/aa/full_html/2025/10/aa56073-25/aa56073-25-eq2.png) (2)
(2)
This trend indicates a potential chemically linked for the two species across diverse astrophysical environments.
The NH2CHO/CH3CONH2 ratios in our sample range from 2.9 to 8.9, with an average of ~5.6 and a standard deviation of ±1.8, and vary relatively little across sources (Fig. 4b). These values are broadly consistent with those reported for Orion KL and IRAS 16293-2422B, although they lie near the lower end of our observed range. G31.41+0.31, with a ratio of ~2, is significantly lower than our sample average (~5.6), while higher ratios have been reported for Sgr B2(N2) (~25; Belloche et al. 2017) and SMM1-a (~18; Ligterink et al. 2022), exceeding the average of this work by factors of ~4.5, and ~3.2, respectively. The observed discrepancies may arise from multiple factors. While uncertainties in excitation temperatures significantly affect the derived column densities, other contributors include optical depth, line blending, spatial structure, and assumptions of LTE. In this work, potential limitations involve the use of 13C isotopologs of NH2CHO to correct for optical depth effects in its emission lines. Additionally, the adopted assumption of uniform source-filling emission for CH3CONH2 may lead to systematic uncertainties. Nevertheless, it is noteworthy that even with these discrepancies, the reported ratios from these works still fall within the same order of magnitude as our study. Given the sensitivity of COM abundances to both temperature and evolutionary stage (Garrod 2013; Garrod et al. 2022), the observed stability suggests that NH2CHO and CH3CONH2 likely form under similar physical and chemical conditions (Quénard et al. 2018; Belloche et al. 2020).
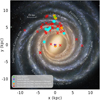 |
Fig. 4 Spatial distribution of CH3CONH2-detected sources projected onto a schematic top-down view of the Milky Way. Cyan symbols represent sources with CH3CONH2 detections in this work, red symbols sources where CH3CONH2 was not detected, and orange symbols previously reported detections from other studies. Notably, IRAS 17175 MM1/MM2 (this work) and NGC 6334I MM1/MM2 (Ligterink et al. 2020) are actually the same HMCs and are therefore shown exclusively with cyan symbols. |
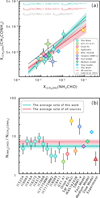 |
Fig. 5 (a) XCH3OH(CH3CONH2) as a function of XCH3OH(NH2CHO). The cyan line and shaded region denote the power-law fit and its uncertainty derived in this work; the red line and shaded region represent the fit and its uncertainty obtained by combining our sources with previous studies; and the gray line shows the fit from Colzi et al. (2021). Symbols and colors correspond to different sources, as shown in the legend. (b) NH2CHO/CH3CONH2 ratios. Ratios from this work are indicated in cyan, while those from previous studies are shown in different colors. The cyan line and shaded region represent the mean ratio and its uncertainty for our data, and the solid red line and shaded region represent the combined sample ratio. |
4.3 Formation pathways of CH3CONH2
Several formation pathways have been proposed for CH3CONH2. Hollis et al. (2006) suggested a gas-phase route involving the addition of a CH2 radical to NH2CHO. However, theoretical studies by Quan & Herbst (2007) indicate that this reaction requires a spin-flip transition of CH2 from the triplet to singlet state, with an energy barrier exceeding 1000 K – rendering it unlikely under typical interstellar conditions. Other proposed gas-phase reactions, such as radiative association between NH2CHO and ![Mathematical equation: $\[\mathrm{CH}_{3}^{+}\]$](/articles/aa/full_html/2025/10/aa56073-25/aa56073-25-eq3.png) (Quan & Herbst 2007), predict CH3CONH2 abundances (~10−15) far below observed levels.
(Quan & Herbst 2007), predict CH3CONH2 abundances (~10−15) far below observed levels.
In contrast, grain-surface chemistry offers a more viable formation mechanism. Agarwal et al. (1985) proposed that CH3CONH2 can form via the reaction between the CH3 radical and the NH2CO intermediate – a key species linking NH2CHO and CH3CONH2. The NH2CO radical can arise through hydrogen abstraction from NH2CHO, radical addition of NH2 and CO, or hydrogenation of HNCO (Belloche et al. 2017, 2019; Garrod et al. 2022). Belloche et al. (2017) predicted an NH2CHO/CH3CONH2 ratio of ~15 assuming only the hydrogen abstraction route. In contrast, Garrod et al. (2022) considered multiple grain-surface formation pathways for CH3CONH2, including: (i) CH3 + NH2CO → CH3CONH2, (ii) H-abstraction from NH2CHO forming NH2CO, followed by CH3 addition, and (iii) hydrogenation of HNCO leading to NH2CO intermediates. These mechanisms all involve NH2CO as a key radical intermediate, thereby establishing a direct chemical connection between NH2CHO and CH3CONH2. Our observed abundance ratios (2.9–8.9) align with Garrod et al.’s predicted range (5–13), providing strong support for a linked formation pathway through grain-surface chemistry.
The strong abundance correlation between NH2CHO and CH3CONH2 may also reflect their co-formation on dust grains, followed by thermal desorption under similar physical conditions – paralleling trends observed for HNCO and NH2CHO (Quénard et al. 2018). Laboratory data further support this view: Ligterink et al. (2018) measured similar desorption temperatures for CH3CONH2 (219 K) and NH2CHO (210 K), while ice mantle simulations yielded a desorption ratio of NH2CHO/CH3CONH2 ~![Mathematical equation: $\[2.5_{-1.2}^{+1.3}\]$](/articles/aa/full_html/2025/10/aa56073-25/aa56073-25-eq4.png) , comparable to our average observed value of 5.6.
, comparable to our average observed value of 5.6.
Taken together, these findings strongly favor a formation scenario in which CH3CONH2 is synthesized via grain-surface chemistry closely linked to NH2CHO, followed by co-desorption in star-forming regions. Nonetheless, additional laboratory, observational, and modeling efforts are required to fully constrain the dominant formation routes.
5 Conclusions
We present the first systematic survey of acetamide (CH3CONH2), a key interstellar amide, in HMCs using ALMA-QUARKS data. The joint detections of formamide (NH2CHO) enable a comparative analysis of their abundance correlation and formation chemistry. Our main findings are as follows:
Both NH2CHO and CH3CONH2 were detected in ten HMCs, increasing the number of known CH3CONH2 sources to 17 and providing the most extensive sample to date for this molecule;
CH3CONH2 column densities, derived via rotational diagram analysis, range from (2.5 ± 0.9) × 1014 to (1.5 ± 0.6) × 1016 cm−2. NH2CHO column densities, estimated from optically thin 13C isotopologs, range from (1.1 ± 0.1) × 1015 to (6.9 ± 0.4) × 1016 cm−2 – typically 3–9 times those of CH3CONH2;
The NH2CHO/CH3CONH2 ratio remains nearly constant (~5.6 on average) across all detected sources. A strong correlation between the two species follows a power-law relation, supporting a chemically linked formation pathway, likely dominated by grain-surface reactions.
These results provide compelling evidence for the presence of complex amide molecules in star-forming regions. The inferred chemical association between NH2CHO and CH3CONH2 highlights the potential role of surface chemistry in assembling peptide-relevant structures prior to planetary formation. The eventual incorporation of such molecules into nascent planetary systems—via cometary or meteoritic delivery – may have contributed essential building blocks for prebiotic chemistry on early Earth and potentially elsewhere. Continued laboratory, observational, and modeling efforts are required to further constrain the dominant formation routes and the broader astrochemical role of interstellar amides.
Data availability
The derived data underlying this article are available in the article and in its online supplementary material on Zenodo.
Acknowledgements
This work makes use of the following ALMA data: ADS/JAO.ALMA#2021.1.00095.S. ALMA is a partnership of ESO (representing its member states), NSF (USA), and NINS (Japan), together with NRC (Canada), MOST and ASIAA (Taiwan, China), and KASI (Republic of Korea), in cooperation with the Republic of Chile. The Joint ALMA Observatory is operated by ESO, AUI/NRAO, and NAOJ. We sincerely thank Prof. Shengli Qin and Dongting Yang (Yunnan University) for their assistance with the data processing. This work was supported by the Fundamental Research Funds for the Central Universities (Grant Nos. 2024CDJGF-025 and 2023CDJXY-045), Chongqing Municipal Natural Science Foundation General Program (Grant No. cstc2021jcyj-msxmX0867), National Natural Science Foundation of China (Grant No. 12103010), and Strategic Priority Research Program of the Chinese Academy of Sciences (Grant No. XDB0800303).
Appendix A Spectral extraction positions
To minimize the effects of absorption and line blending, we extracted spectra at offset positions from the continuum peaks for further analysis. The extraction positions for each source are shown in Fig. A.1, where they are marked by white points.
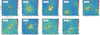 |
Fig. A.1 1.3 mm continuum image of I15254, I16065, I16164, I16272, I16318, I17008, I17175, I18089, and I18411 obtained with ALMA Band 6. The background shows the continuum emission of each source. Contour levels are drawn at (3, 5, 10, 20, 30, 50, 100, 200) ×σ, where σ is the rms noise level. The 1σ values of I15254, I16065, I16164, I16272, I16318, I17008, I17175, I18089, and I18411 are 1.92, 2.75, 4.13, 1.75, 1.51, 2.80, 6.90, 2.60, and 2.80 mJy beam−1, respectively. The synthetic beam for continuum is indicated in the bottom-left corner by the ellipse. The spectral extraction positions are indicated with a white point. |
Appendix B The identified spectral lines of amide molecules
The emissions of CH3CONH2, NH2CHO, and NH213CHO are detected in ten sources. Figure B.1 show the detected transitions of these amide molecules, which are not covered in the Fig. 1, for all hot cores.
 |
Fig. B.1 Observed (black) and modeled (red) spectra of CH3CONH2, NH2CHO, and NH213CHO in nine HMCs. Clearly resolved or slightly blended transitions are shown. Dashed green lines mark the 3σ noise level. No modeled spectrum is shown for NH2CHO due to optical thickness. Dashed red lines indicate the rest frequencies of NH2CHO transitions. The y-axis shows the line intensity in K, and the x-axis shows the frequency in MHz. |
Appendix C Summary of detected molecular lines
This appendix presents the statistics of detected lines in our observations. Tables C.1–C.10, only available on Zenodo, compile all detected line information for each amide species across the ten HMCs. These data provide essential constraints for the derivation of column densities and excitation temperatures.
Appendix D The upper limits of column density for CH3CONH2 in undetected sources
For the 42 sources where CH3CONH2 was not detected, 3σ upper limits for its column density has been derived. Fig D.1(a) compares these upper limits with the derived column densities in the 10 detections. The upper limits generally fall within an order of magnitude of the detected values, suggesting that sensitivity limitations, rather than a true absence of CH3CONH2, can account for many of the non-detections. To further explore this, the relationship between CH3CONH2/CH3OH ratios and CH3OH column densities have been examined (Fig. D.1b). All ten CH3CONH2-detected sources exhibit higher CH3OH column densities, supporting the idea that CH3CONH2 is more likely to be detected in chemically rich environments. Nonetheless, 6 non-detected sources with CH3OH column densities > 4 × 1018 cm−2, show no CH3CONH2 detection, suggesting that CH3OH abundance alone is not a sufficient predictor. These results emphasize the need for higher-sensitivity observations to better constrain the prevalence and formation conditions of interstellar acetamide.
 |
Fig. D.1 (a) Derived column densities (10 sources with CH3CONH2 detections, indicated in red) or upper limits (42 sources without CH3CONH2 detections, indicated in cyan) for all sources. (b) Relationship between the CH3CONH2/CH3OH and CH3OH column densities. |
References
- Agarwal, V. K., Schutte, W., Greenberg, J. M., et al. 1985, Origins Life, 16, 21 [NASA ADS] [CrossRef] [Google Scholar]
- Belloche, A., Meshcheryakov, A. A., Garrod, R. T., et al. 2017, A&A, 601, A49 [NASA ADS] [CrossRef] [EDP Sciences] [Google Scholar]
- Belloche, A., Garrod, R. T., Müller, H. S. P., et al. 2019, A&A, 628, A10 [NASA ADS] [CrossRef] [EDP Sciences] [Google Scholar]
- Belloche, A., Maury, A. J., Maret, S., et al. 2020, A&A, 635, A198 [NASA ADS] [CrossRef] [EDP Sciences] [Google Scholar]
- Bøgelund, E. G., McGuire, B. A., Ligterink, N. F. W., et al. 2018, A&A, 615, A88 [Google Scholar]
- Bonfand, M., Belloche, A., Garrod, R. T., et al. 2019, A&A, 628, A27 [NASA ADS] [CrossRef] [EDP Sciences] [Google Scholar]
- Cernicharo, J., Kisiel, Z., Tercero, B., et al. 2016, A&A, 587, L4 [NASA ADS] [CrossRef] [EDP Sciences] [Google Scholar]
- Chyba, C., & Sagan, C. 1992, Nature, 355, 125 [NASA ADS] [CrossRef] [Google Scholar]
- Chyba, C. F., Thomas, P. J., Brookshaw, L., & Sagan, C. 1990, Science, 249, 366 [NASA ADS] [CrossRef] [Google Scholar]
- Colzi, L., Rivilla, V. M., Beltrán, M. T., et al. 2021, A&A, 653, A129 [NASA ADS] [CrossRef] [EDP Sciences] [Google Scholar]
- Comrie, A., Wang, K.-S., Hsu, S.-C., et al. 2021, Astrophysics Source Code Library [record ascl:2103.031] [Google Scholar]
- Garrod, R. T. 2013, ApJ, 765, 60 [Google Scholar]
- Garrod, R. T., Jin, M., Matis, K. A., et al. 2022, ApJS, 259, 1 [NASA ADS] [CrossRef] [Google Scholar]
- Halfen, D. T., Ilyushin, V., & Ziurys, L. M. 2011, ApJ, 743, 60 [Google Scholar]
- Hollis, J. M., Lovas, F. J., Remijan, A. J., et al. 2006, ApJ, 643, L25 [Google Scholar]
- Ilyushin, V. V., Alekseev, E. A., Dyubko, S. F., Kleiner, I., & Hougen, J. T. 2004, J. Mol. Spectrosc., 227, 115 [Google Scholar]
- Jørgensen, J. K., Müller, H. S. P., Calcutt, H., et al. 2018, A&A, 620, A170 [Google Scholar]
- Li, Y., Wang, J., Li, J., Liu, S., & Luo, Q. 2022, MNRAS, 512, 4934 [NASA ADS] [CrossRef] [Google Scholar]
- Ligterink, N. F. W., Coutens, A., Kofman, V., et al. 2017, MNRAS, 469, 2219 [Google Scholar]
- Ligterink, N. F. W., Terwisscha van Scheltinga, J., Taquet, V., et al. 2018, MNRAS, 480, 3628 [Google Scholar]
- Ligterink, N. F. W., El-Abd, S. J., Brogan, C. L., et al. 2020, ApJ, 901, 37 [Google Scholar]
- Ligterink, N. F. W., Ahmadi, A., Luitel, B., et al. 2022, ACS Earth Space Chem., 6, 455 [NASA ADS] [CrossRef] [Google Scholar]
- Liu, T., Evans, N. J., Kim, K.-T., et al. 2020, MNRAS, 496, 2790 [Google Scholar]
- Liu, X., Liu, T., Shen, Z., et al. 2022, ApJS, 263, 13 [NASA ADS] [CrossRef] [Google Scholar]
- Liu, X., Liu, T., Zhu, L., et al. 2024, Res. Astron. Astrophys., 24, 025009 [CrossRef] [Google Scholar]
- López-Sepulcre, A., Balucani, N., Ceccarelli, C., et al. 2019, ACS Earth and Space Chemistry, 3, 2122 [Google Scholar]
- Mininni, C., Beltrán, M. T., Colzi, L., et al. 2023, A&A, 677, A15 [NASA ADS] [CrossRef] [EDP Sciences] [Google Scholar]
- Müller, H. S. P., Thorwirth, S., Roth, D. A., & Winnewisser, G. 2001, A&A, 370, L49 [Google Scholar]
- Müller, H. S. P., Schlöder, F., Stutzki, J., & Winnewisser, G. 2005, J. Mol. Struct., 742, 215 [Google Scholar]
- Patel, B. H., Percivalle, C., Ritson, D. J., Duffy, C. D., & Sutherland, J. D. 2015, Nat. Chem., 7, 301 [Google Scholar]
- Pauling, L., Corey, R. B., & Branson, H. R. 1951, PNAS, 37, 205 [Google Scholar]
- Pearce, B. K. D., Tupper, A. S., Pudritz, R. E., & Higgs, P. G. 2018, Astrobiology, 18, 343 [Google Scholar]
- Qin, S.-L., Liu, T., Liu, X., et al. 2022, MNRAS, 511, 3463 [CrossRef] [Google Scholar]
- Quan, D., & Herbst, E. 2007, A&A, 474, 521 [NASA ADS] [CrossRef] [EDP Sciences] [Google Scholar]
- Quénard, D., Jiménez-Serra, I., Viti, S., Holdship, J., & Coutens, A. 2018, MNRAS, 474, 2796 [Google Scholar]
- Xu, X., Wang, J., Gou, Q., et al. 2025, PASJ, 77, 307 [Google Scholar]
- Yan, Y. T., Henkel, C., Kobayashi, C., et al. 2023, A&A, 670, A98 [NASA ADS] [CrossRef] [EDP Sciences] [Google Scholar]
- Zeng, S., Rivilla, V. M., Jiménez-Serra, I., et al. 2023, MNRAS, 523, 1448 [NASA ADS] [CrossRef] [Google Scholar]
- Zhang, C., Zhu, F.-Y., Liu, T., et al. 2023, MNRAS, 520, 3245 [NASA ADS] [CrossRef] [Google Scholar]
- Zheng, S., Li, J., Wang, J., et al. 2024, ApJ, 961, 58 [NASA ADS] [CrossRef] [Google Scholar]
All Tables
All Figures
|
Fig. 1 Observed (black) and modeled (red) spectra of CH3CONH2, NH2CHO, and NH213CHO in I17175 MM2. Clearly resolved or slightly blended transitions are shown. Dashed green lines mark the 3σ noise level. No modeled spectrum is shown for NH2CHO due to optical thickness. Dashed red lines indicate the rest frequencies of NH2CHO transitions. Spectra for other sources are shown in Fig. B.1. |
| In the text | |
|
Fig. 2 Rotational diagrams of CH3CONH2 and NH213CHO. Black points represent the observed data, while red lines indicate the best-fit results. Shaded red regions denote the associated fitting uncertainties. Each panel includes the source name and molecule in the top-right corner, with the derived rotational temperature (Trot) and column density (N) shown in the bottom-left. |
| In the text | |
|
Fig. 3 Integrated emission maps of NH2CHO (black) and CH3CONH2 (blue), overlaid with 1.3 mm continuum emission. Contour levels are 10%, 20%, 40%, 60%, and 80% of the peak values. The solid ellipse in the bottom-left corner indicates the synthesized beam for the continuum. |
| In the text | |
|
Fig. 4 Spatial distribution of CH3CONH2-detected sources projected onto a schematic top-down view of the Milky Way. Cyan symbols represent sources with CH3CONH2 detections in this work, red symbols sources where CH3CONH2 was not detected, and orange symbols previously reported detections from other studies. Notably, IRAS 17175 MM1/MM2 (this work) and NGC 6334I MM1/MM2 (Ligterink et al. 2020) are actually the same HMCs and are therefore shown exclusively with cyan symbols. |
| In the text | |
|
Fig. 5 (a) XCH3OH(CH3CONH2) as a function of XCH3OH(NH2CHO). The cyan line and shaded region denote the power-law fit and its uncertainty derived in this work; the red line and shaded region represent the fit and its uncertainty obtained by combining our sources with previous studies; and the gray line shows the fit from Colzi et al. (2021). Symbols and colors correspond to different sources, as shown in the legend. (b) NH2CHO/CH3CONH2 ratios. Ratios from this work are indicated in cyan, while those from previous studies are shown in different colors. The cyan line and shaded region represent the mean ratio and its uncertainty for our data, and the solid red line and shaded region represent the combined sample ratio. |
| In the text | |
|
Fig. A.1 1.3 mm continuum image of I15254, I16065, I16164, I16272, I16318, I17008, I17175, I18089, and I18411 obtained with ALMA Band 6. The background shows the continuum emission of each source. Contour levels are drawn at (3, 5, 10, 20, 30, 50, 100, 200) ×σ, where σ is the rms noise level. The 1σ values of I15254, I16065, I16164, I16272, I16318, I17008, I17175, I18089, and I18411 are 1.92, 2.75, 4.13, 1.75, 1.51, 2.80, 6.90, 2.60, and 2.80 mJy beam−1, respectively. The synthetic beam for continuum is indicated in the bottom-left corner by the ellipse. The spectral extraction positions are indicated with a white point. |
| In the text | |
|
Fig. B.1 Observed (black) and modeled (red) spectra of CH3CONH2, NH2CHO, and NH213CHO in nine HMCs. Clearly resolved or slightly blended transitions are shown. Dashed green lines mark the 3σ noise level. No modeled spectrum is shown for NH2CHO due to optical thickness. Dashed red lines indicate the rest frequencies of NH2CHO transitions. The y-axis shows the line intensity in K, and the x-axis shows the frequency in MHz. |
| In the text | |
|
Fig. D.1 (a) Derived column densities (10 sources with CH3CONH2 detections, indicated in red) or upper limits (42 sources without CH3CONH2 detections, indicated in cyan) for all sources. (b) Relationship between the CH3CONH2/CH3OH and CH3OH column densities. |
| In the text | |
Current usage metrics show cumulative count of Article Views (full-text article views including HTML views, PDF and ePub downloads, according to the available data) and Abstracts Views on Vision4Press platform.
Data correspond to usage on the plateform after 2015. The current usage metrics is available 48-96 hours after online publication and is updated daily on week days.
Initial download of the metrics may take a while.