Open Access
Fig. 3
Download original image
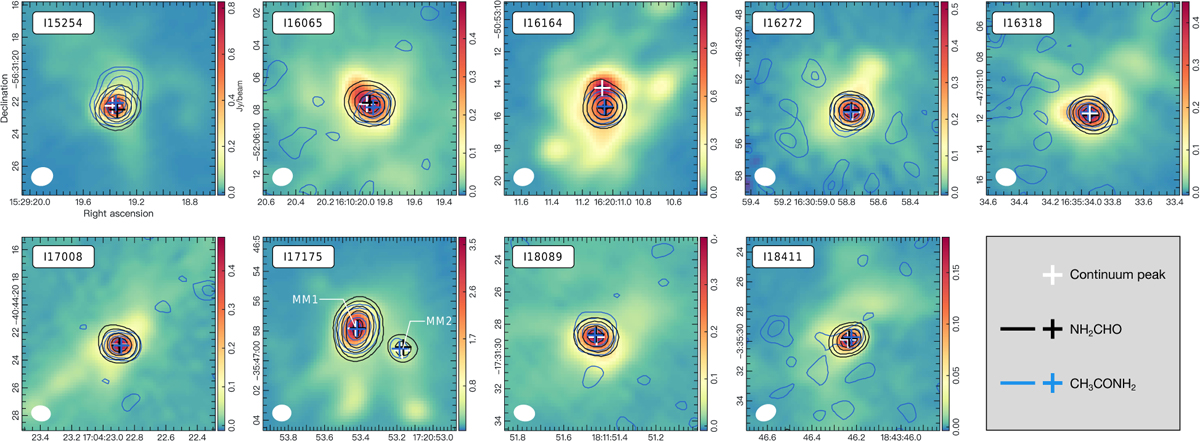
Integrated emission maps of NH2CHO (black) and CH3CONH2 (blue), overlaid with 1.3 mm continuum emission. Contour levels are 10%, 20%, 40%, 60%, and 80% of the peak values. The solid ellipse in the bottom-left corner indicates the synthesized beam for the continuum.
Current usage metrics show cumulative count of Article Views (full-text article views including HTML views, PDF and ePub downloads, according to the available data) and Abstracts Views on Vision4Press platform.
Data correspond to usage on the plateform after 2015. The current usage metrics is available 48-96 hours after online publication and is updated daily on week days.
Initial download of the metrics may take a while.