Fig. 4
Download original image
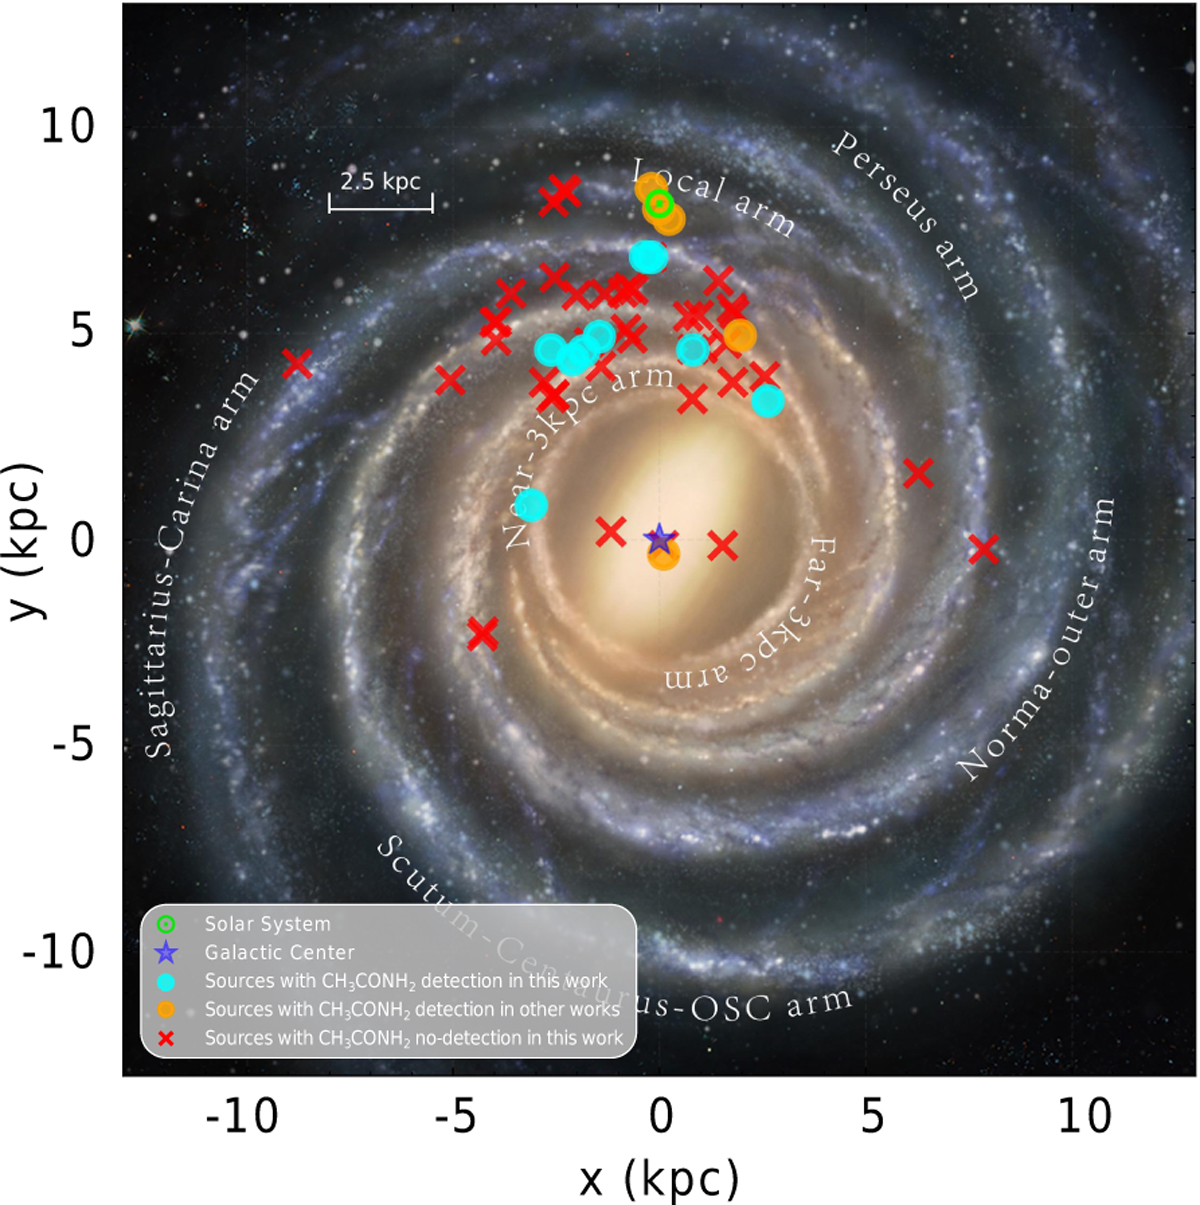
Spatial distribution of CH3CONH2-detected sources projected onto a schematic top-down view of the Milky Way. Cyan symbols represent sources with CH3CONH2 detections in this work, red symbols sources where CH3CONH2 was not detected, and orange symbols previously reported detections from other studies. Notably, IRAS 17175 MM1/MM2 (this work) and NGC 6334I MM1/MM2 (Ligterink et al. 2020) are actually the same HMCs and are therefore shown exclusively with cyan symbols.
Current usage metrics show cumulative count of Article Views (full-text article views including HTML views, PDF and ePub downloads, according to the available data) and Abstracts Views on Vision4Press platform.
Data correspond to usage on the plateform after 2015. The current usage metrics is available 48-96 hours after online publication and is updated daily on week days.
Initial download of the metrics may take a while.