Fig. 5
Download original image
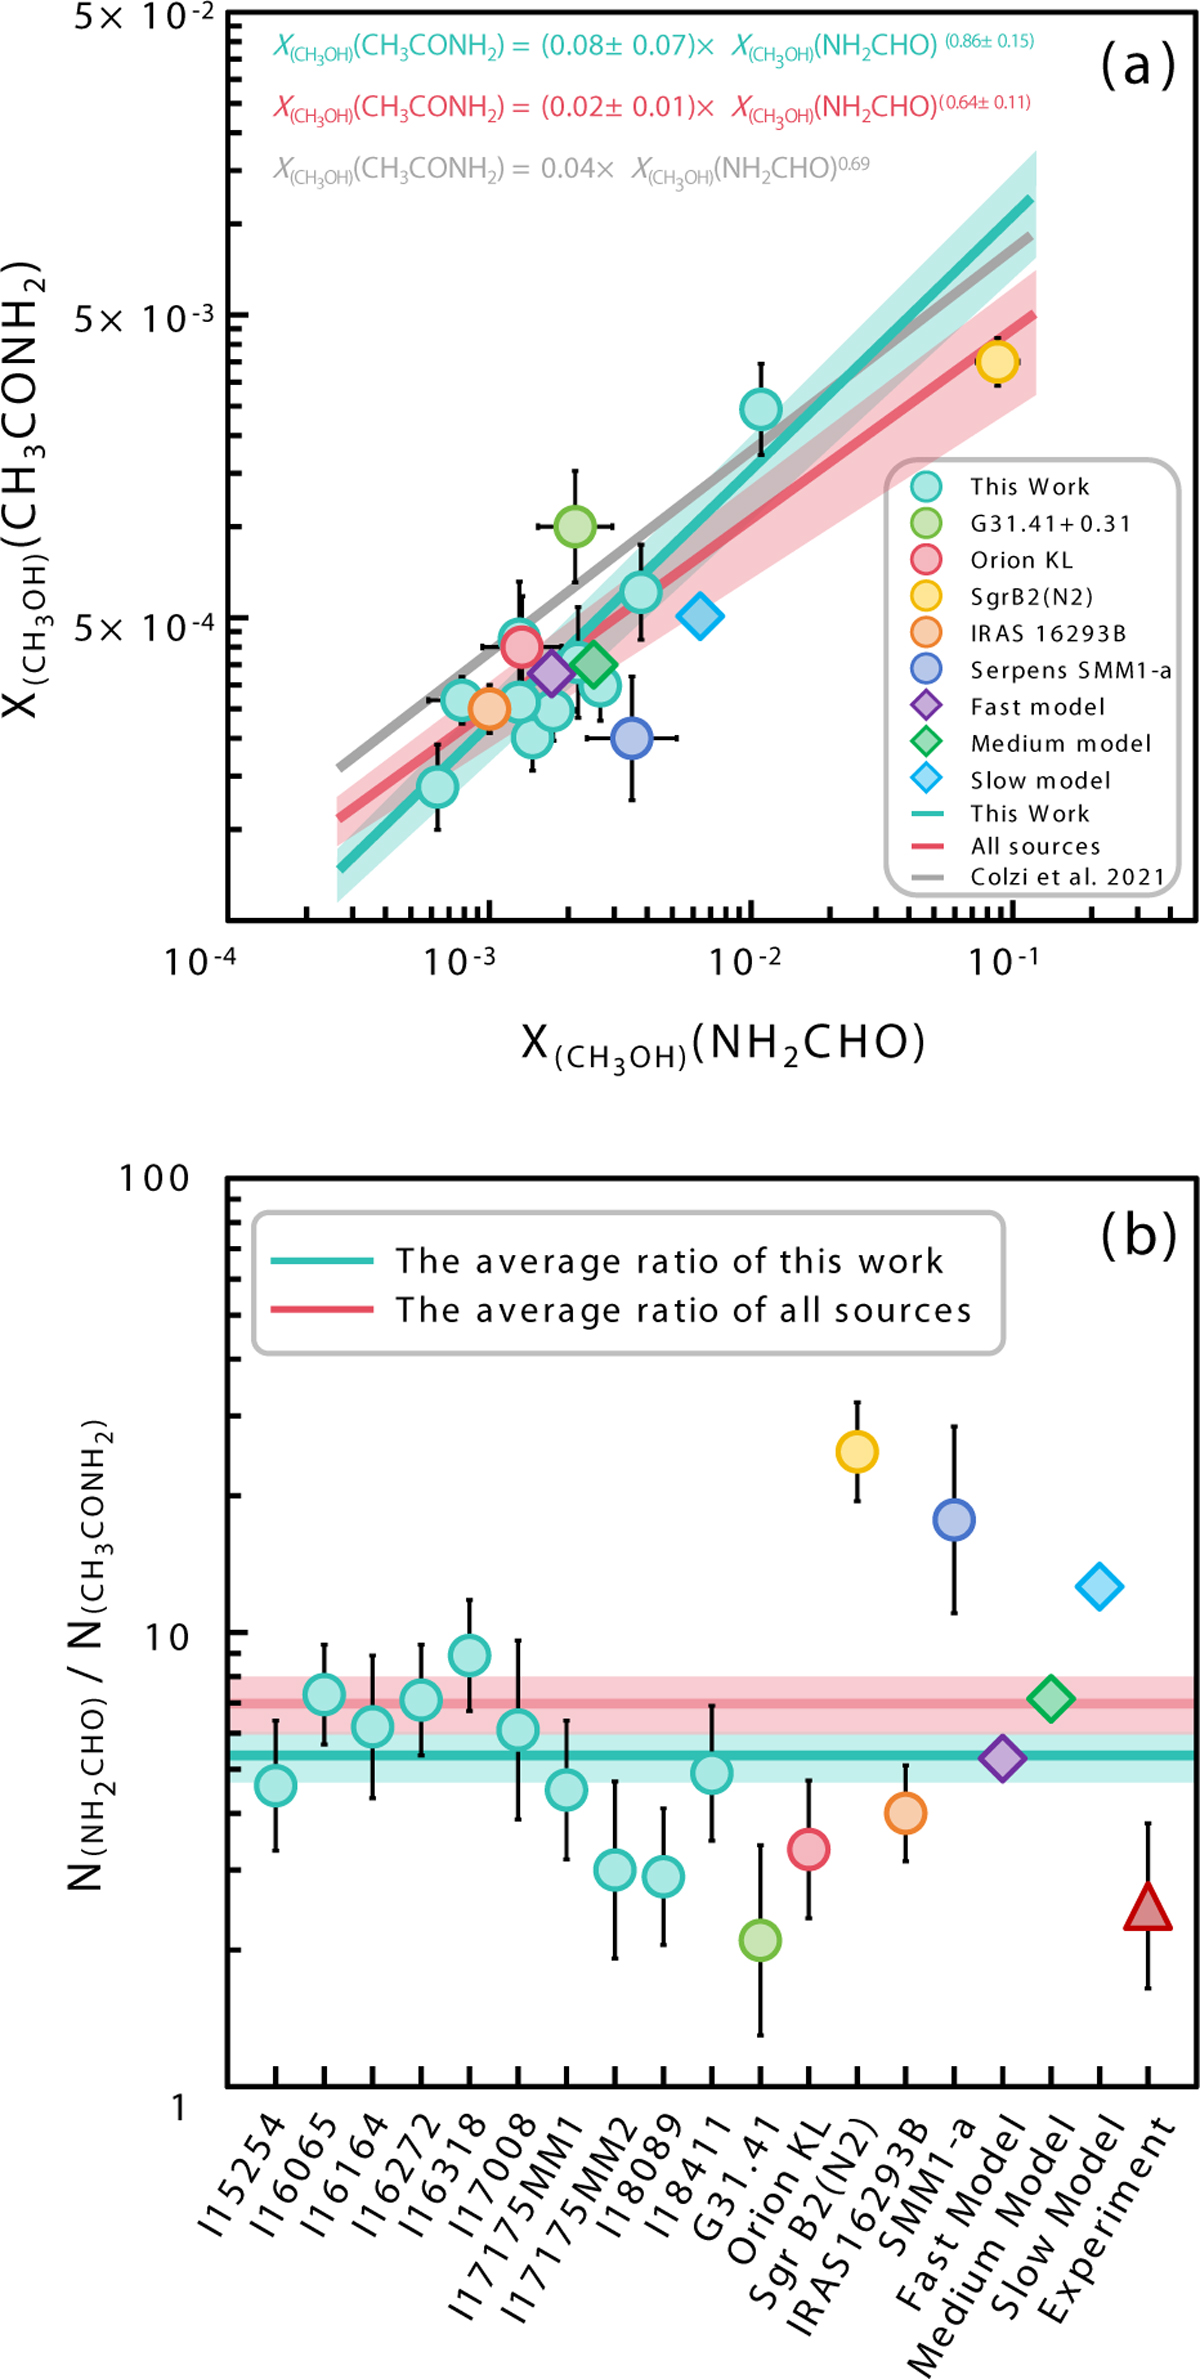
(a) XCH3OH(CH3CONH2) as a function of XCH3OH(NH2CHO). The cyan line and shaded region denote the power-law fit and its uncertainty derived in this work; the red line and shaded region represent the fit and its uncertainty obtained by combining our sources with previous studies; and the gray line shows the fit from Colzi et al. (2021). Symbols and colors correspond to different sources, as shown in the legend. (b) NH2CHO/CH3CONH2 ratios. Ratios from this work are indicated in cyan, while those from previous studies are shown in different colors. The cyan line and shaded region represent the mean ratio and its uncertainty for our data, and the solid red line and shaded region represent the combined sample ratio.
Current usage metrics show cumulative count of Article Views (full-text article views including HTML views, PDF and ePub downloads, according to the available data) and Abstracts Views on Vision4Press platform.
Data correspond to usage on the plateform after 2015. The current usage metrics is available 48-96 hours after online publication and is updated daily on week days.
Initial download of the metrics may take a while.