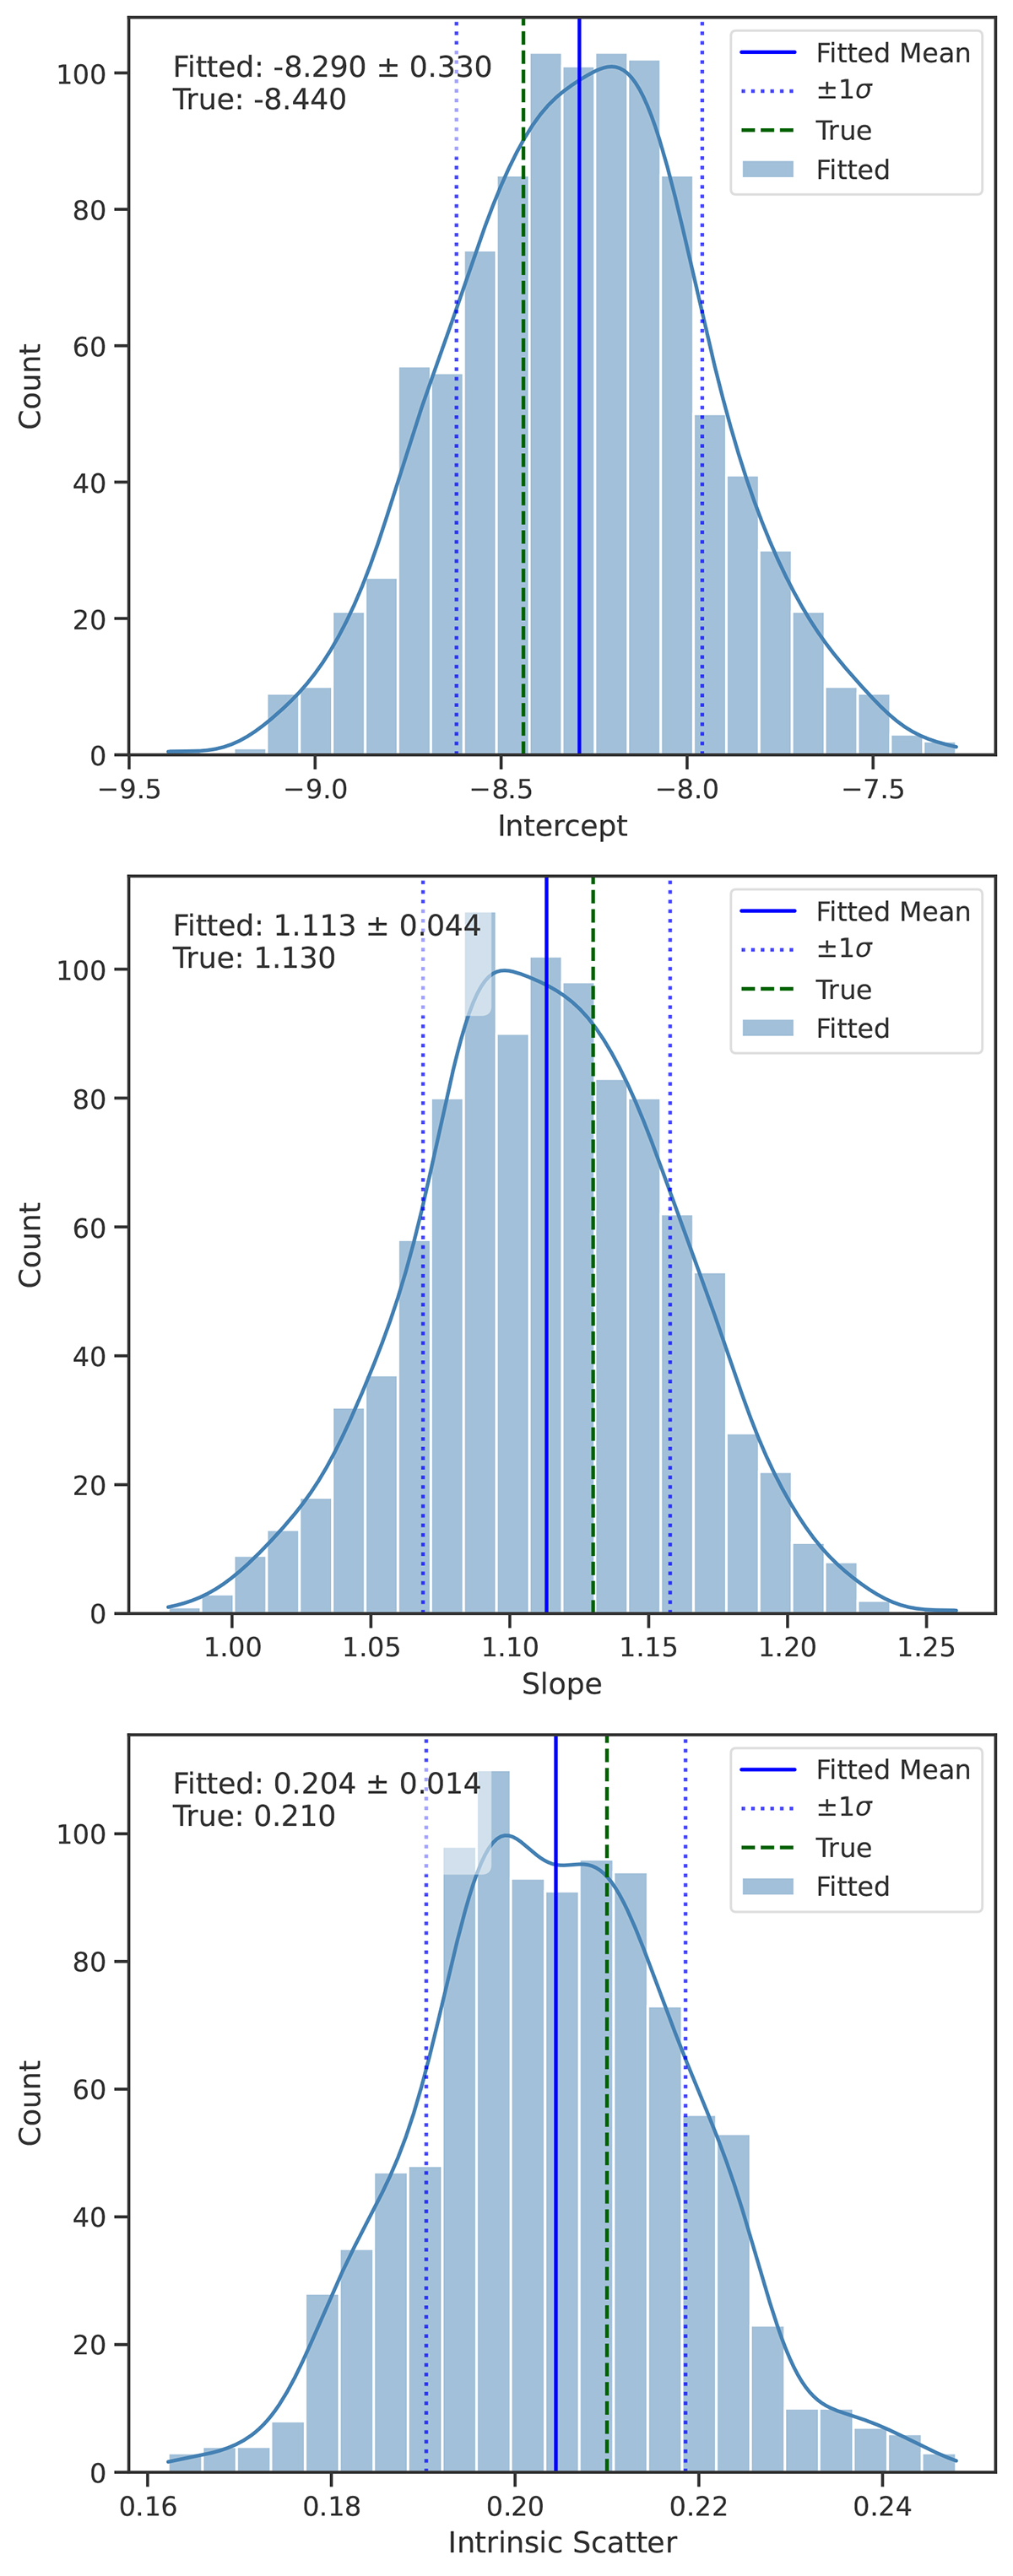
Fig. D.1.
Download original image
Distributions of the fitted parameters obtained from 1000 simulated datasets (see Appendix D). From top to bottom : intercept, slope, and intrinsic scatter. The blue histograms show the results from our likelihood-based fitting method, with the solid and dotted blue lines indicating the mean and the ±1σ intervals. The true input value used to generate the simulations is shown as a dashed green line. Each panel is annotated with the mean and standard deviation of the fitted parameter and the true input value in the top left corner.
Current usage metrics show cumulative count of Article Views (full-text article views including HTML views, PDF and ePub downloads, according to the available data) and Abstracts Views on Vision4Press platform.
Data correspond to usage on the plateform after 2015. The current usage metrics is available 48-96 hours after online publication and is updated daily on week days.
Initial download of the metrics may take a while.