Fig. 4.
Download original image
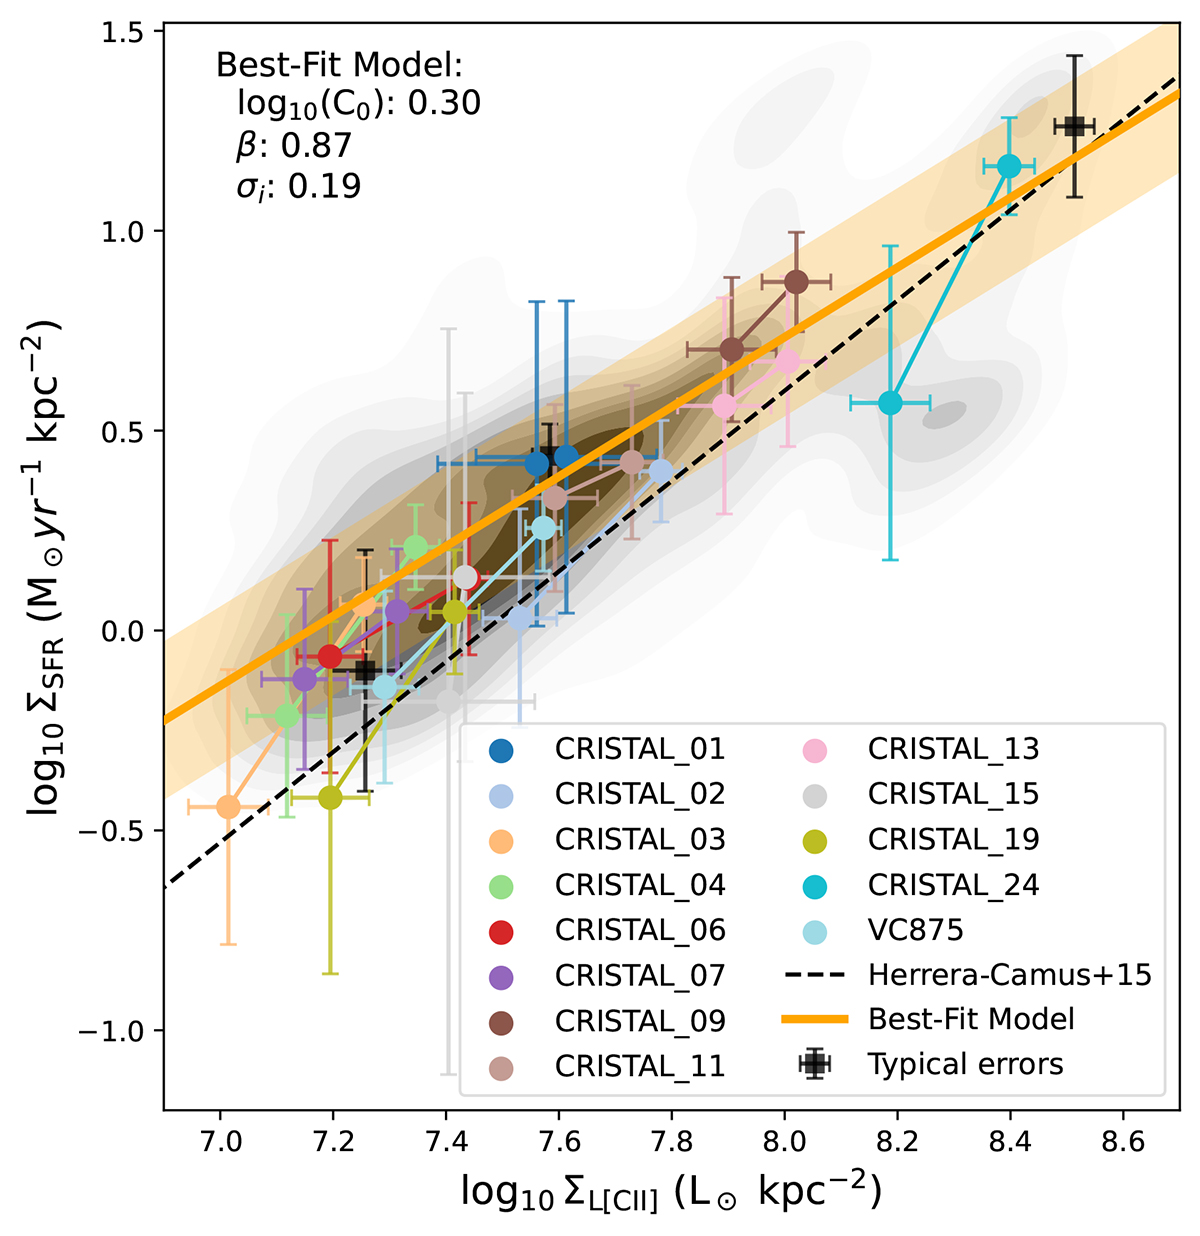
Resolved [CII]-SFR relation for galaxies at z ∼ 5. The grey contours show the individual pixel distribution for the whole sample. Each pair of coloured points represents a high- and low-[CII] density average region for each galaxy of the sample following B23 methodology. The orange line and shaded region shows our best-fit power-law model from the tailored likelihood-based approach with the parameters in the top left corner (where log10(C0) is the value at g0 = 107.5 L⊙ kpc−2). The dashed black line presents the extrapolation of the relation derived from a spatially resolved sample of 46 nearby galaxies by Herrera-Camus et al. (2015). We represented the typical errors bars for the individual pixels across the sample with three black squares.
Current usage metrics show cumulative count of Article Views (full-text article views including HTML views, PDF and ePub downloads, according to the available data) and Abstracts Views on Vision4Press platform.
Data correspond to usage on the plateform after 2015. The current usage metrics is available 48-96 hours after online publication and is updated daily on week days.
Initial download of the metrics may take a while.