Fig. 5.
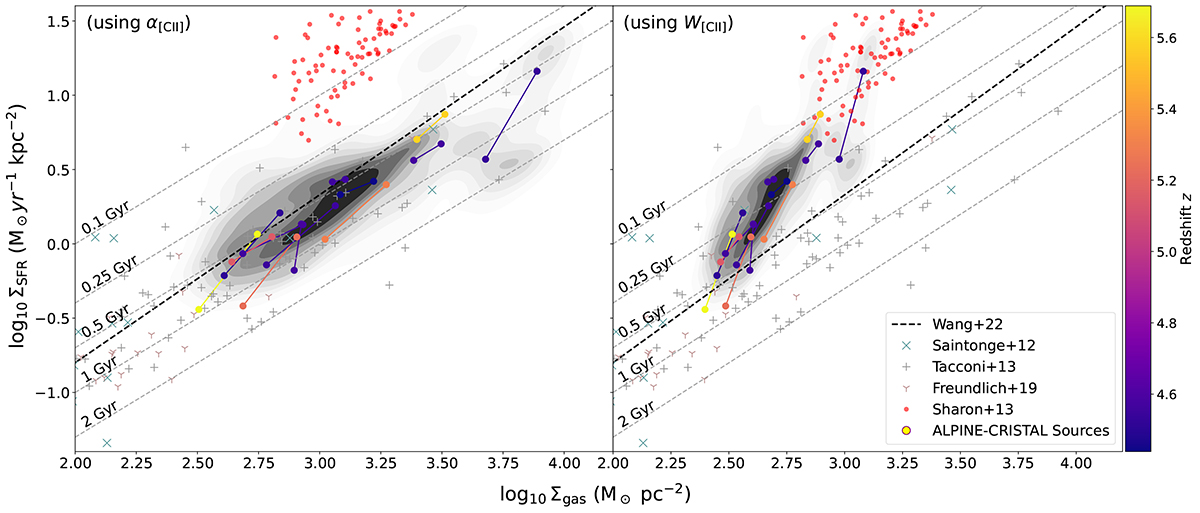
Download original image
Kennicutt-Schmidt relation using the α[CII] conversion factor (left) and the W[CII] version (right). The grey contours show the distribution of individual pixel measurements across the entire sample; the pair of points are the B23 region averages for individual galaxies, colour-coded by redshift. The dashed grey lines show constant gas depletion time. The dashed black line represents the Wang et al. (2022) KS relation for local Universe and high-redshift main-sequence galaxies. We show CO measurements of the global KS relation from the low-z COLD GASS sample (Saintonge et al. 2012, crosses) and at redshifts up to z ∼ 2.5 from the PHIBBS (Tacconi et al. 2013, plus signs) and PHIBBS2 (Freundlich et al. 2019, three-branch stars) programmes, together with a resolved z = 2.6 lensed starburst (Sharon et al. 2013, red points).
Current usage metrics show cumulative count of Article Views (full-text article views including HTML views, PDF and ePub downloads, according to the available data) and Abstracts Views on Vision4Press platform.
Data correspond to usage on the plateform after 2015. The current usage metrics is available 48-96 hours after online publication and is updated daily on week days.
Initial download of the metrics may take a while.