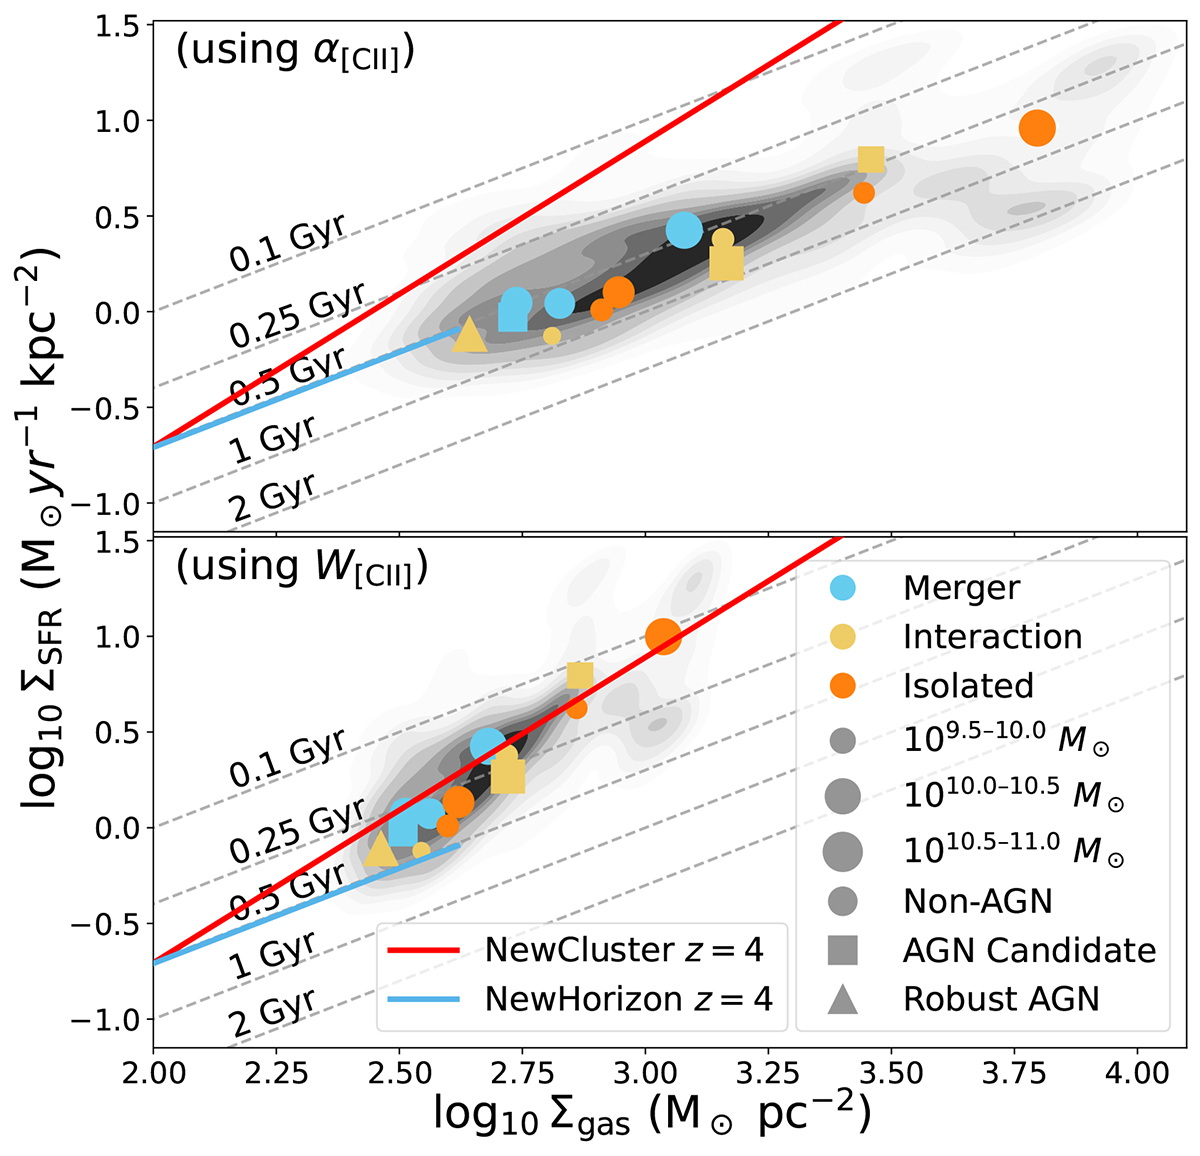
Fig. 6.
Download original image
Similar to Fig. 5. This time, symbols indicate integrated measurements for individual galaxies, colour-coded by interaction state: light blue for major mergers, light yellow for interacting systems, and orange for isolated galaxies, following the classification of Herrera-Camus et al. (2025). Symbol size encodes the total stellar mass and symbol shape denotes AGN identification: circles for non-AGNs, squares for AGN candidates, and triangles for robust AGNs as per Ren et al. (in prep.). The solid blue line shows the z = 4 relation from Kraljic et al. (2024), based on the 25% most massive galaxies in the NewHorizon simulation, while the solid red line indicates the NewCluster analogue (Han et al. 2025). Both relations are plotted over their effective gas mass ranges for direct comparison with our sample.
Current usage metrics show cumulative count of Article Views (full-text article views including HTML views, PDF and ePub downloads, according to the available data) and Abstracts Views on Vision4Press platform.
Data correspond to usage on the plateform after 2015. The current usage metrics is available 48-96 hours after online publication and is updated daily on week days.
Initial download of the metrics may take a while.