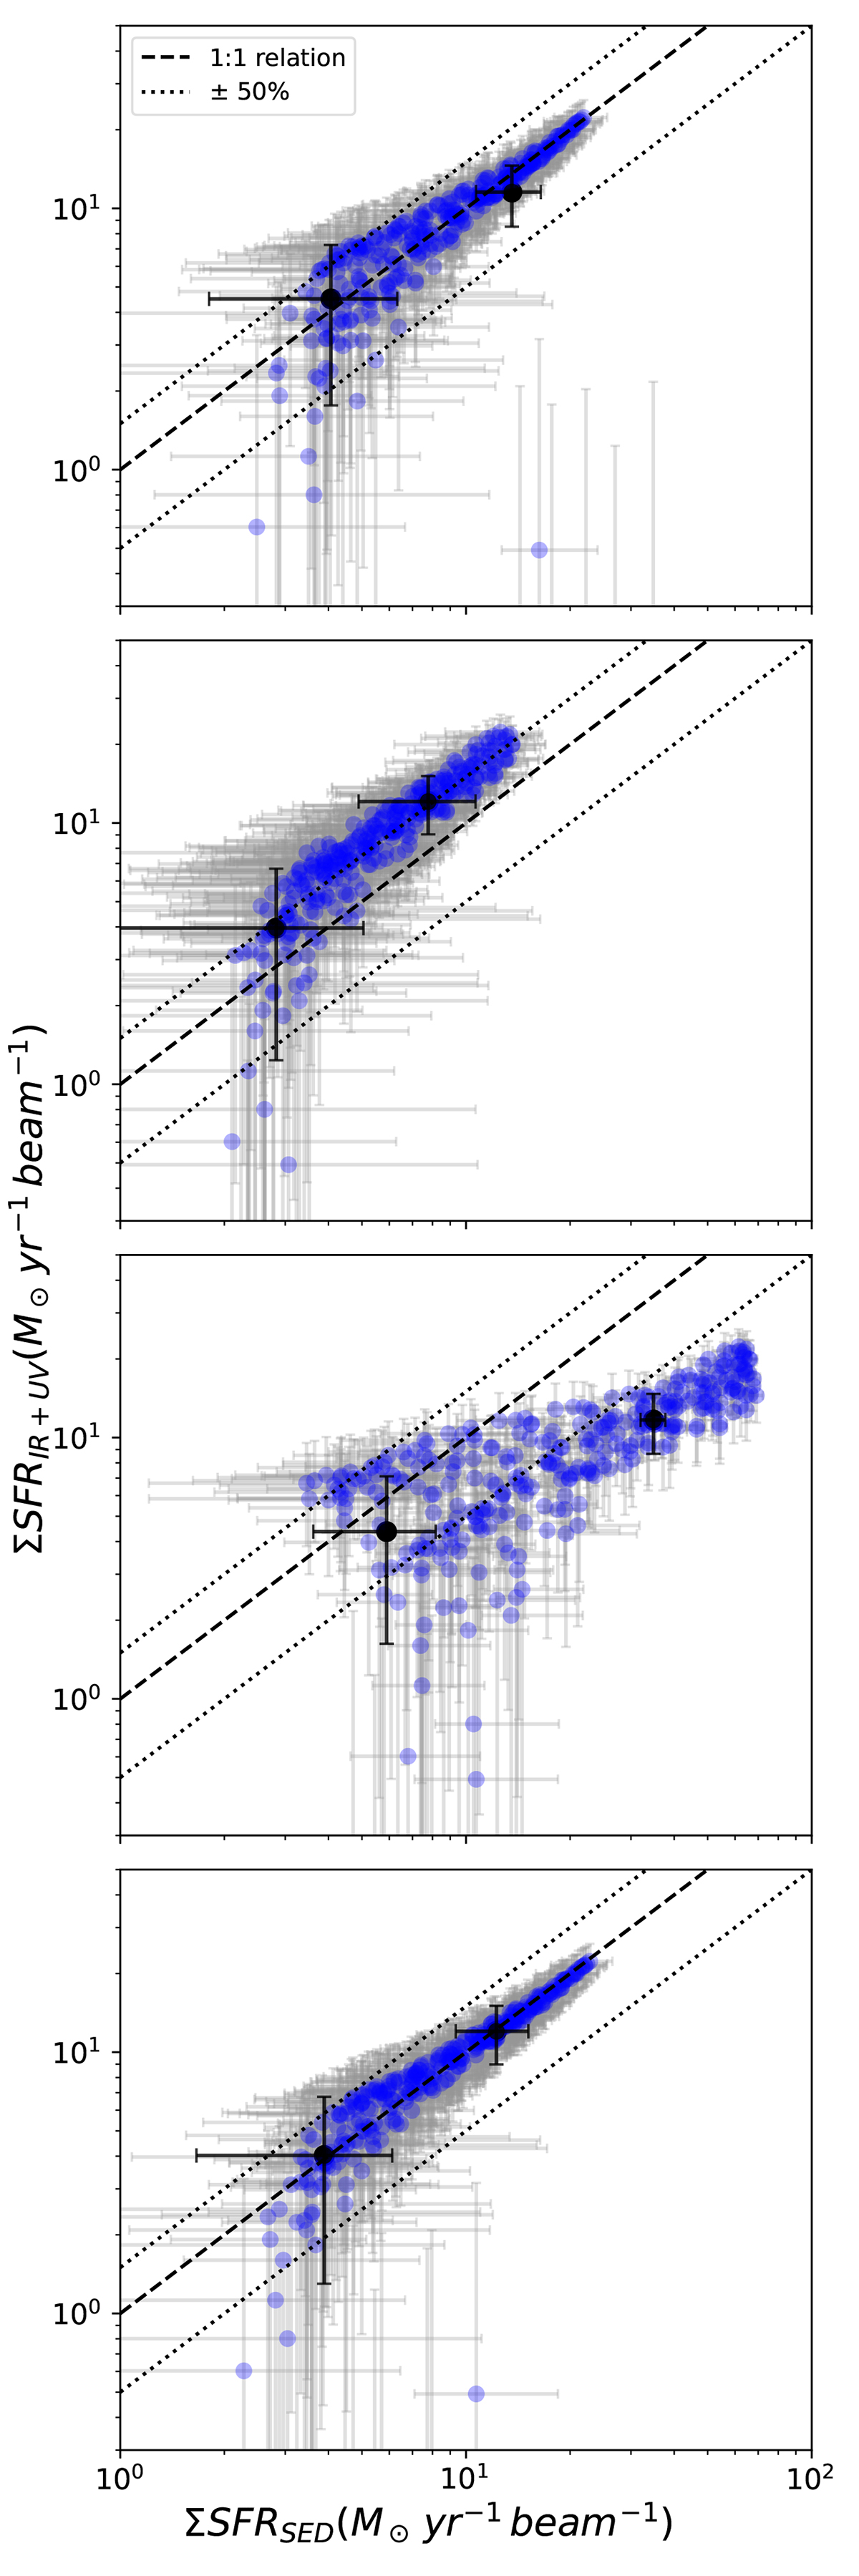
Fig. C.1.
Download original image
Comparison between SFR derived from SED modelling (SFRSED) and those measured from IR+UV observations (SFRIR + UV) for VC875, shown for different model parametrisations. From top to bottom: (first) the fiducial model using the Charlot & Fall (2000) dust attenuation law and a delayed SFH with a recent variation episode; (second) the same, but without the recent variation episode; (third) the fiducial model without ALMA dust luminosity constraints; (fourth) the Calzetti et al. (1994) attenuation law model. Blue points represent individual pixels, with error bars corresponding to the 16th and 84th percentiles of the SED-derived SFR distribution (see Sect. 3.1). Red arrows indicate upper limits. Black points show region-averaged SFR values computed using the B23 method. The dashed line indicates the one-to-one relation, and dotted lines mark the ±50% range.
Current usage metrics show cumulative count of Article Views (full-text article views including HTML views, PDF and ePub downloads, according to the available data) and Abstracts Views on Vision4Press platform.
Data correspond to usage on the plateform after 2015. The current usage metrics is available 48-96 hours after online publication and is updated daily on week days.
Initial download of the metrics may take a while.